- We look at the data sources available for AUD IRS markets….
- …and try to reconcile some of the numbers
- We quickly find this is not as easy as it first appears….
- …and conclude that publicly disseminated, trade-level reporting is the only way to add true transparency to OTC derivative markets.
The great data reconciliation game continues this week. As OTC markets become ever more transparent, it’s important to understand what data is available and from where. Therefore, I’ve taken a look at AUD OTC Rates markets to make sense of the data out there.
First off – the bad news
For most Rates market, we generally have up to 6 sources of information:
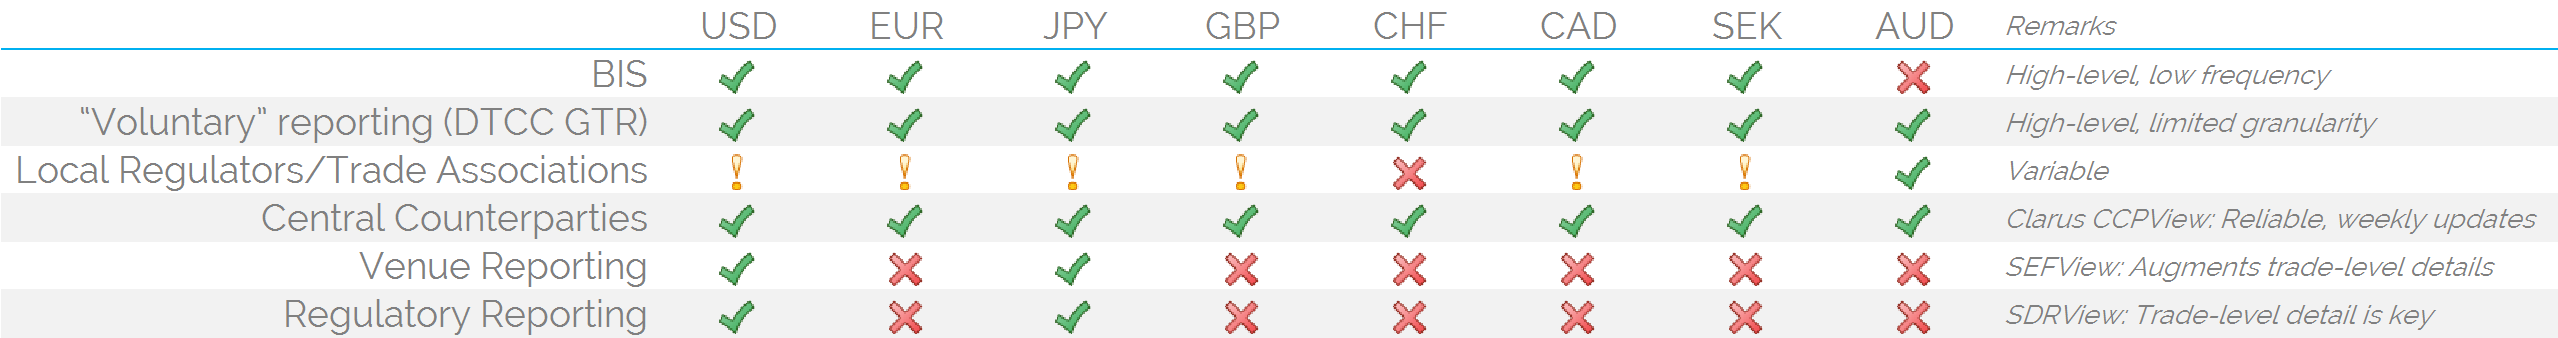
At the moment, only USD and JPY can hope to put a tick in the box of every source. However, what I didn’t realise is that the BIS only covers a few of the major currencies in any kind of detail. Sadly for this blog, AUD isn’t one of the currencies that BIS provides any breakdown for.
Now – the Good news
Thankfully, the Australian regulator and trade associations are more than happy to step into the BIS’s shoes and provide some impressively detailed data instead. Therefore, let’s step into the AFMA-provided Australian Financial Markets Report (AFMR) and explain what data we can see for OTC Rates.
Coverage
This is the key area of differentiation for the AFMR. Broadly speaking, the report looks at on-shore activity in Australia only.
The latest report was conducted by means of a survey, and covers the period from 1st July 2014 to 30th June 2015.
The data itself can be downloaded as a 13-page excel worksheet, and the Rates tab alone covers over 5,000 data points including customer type, product type, currency and maturity breakdowns. So the data that is there is nicely granular. It also clearly identifies if we are looking at Turnover data (generally useful) or Outstanding notional (generally less useful).
There is also data going back, on an annual basis, to 2010. Which is great!
CCP Coverage
So, how’s about some comparison figures to look at what the AFMR coverage is like?
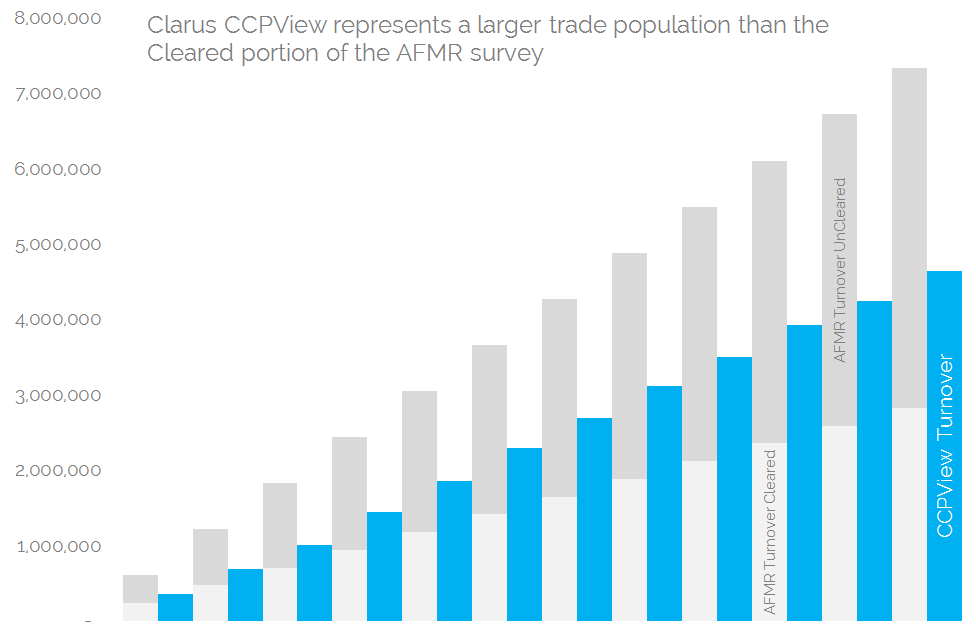
First off – let’s look at the highest level of coverage available from our Clarus data-set – CCPView.
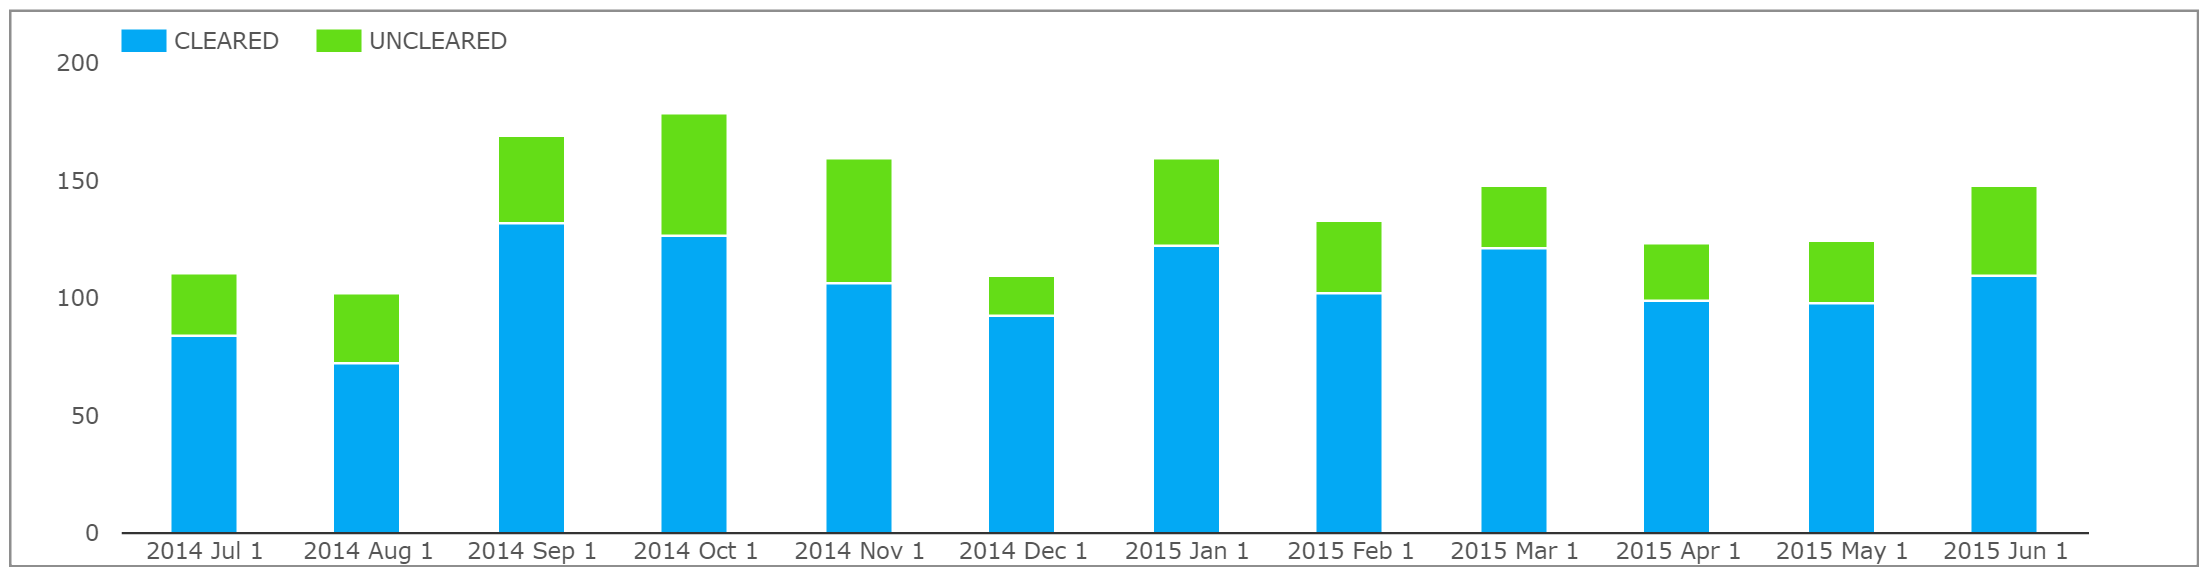
For vanilla, Fixed-Float AUD IRS swaps (excluding OIS and Tenor Basis), we have 3 clearing houses (LCH across two legal entities, ASX and CME) with turnover figures reported for the past year. We compare this with the AFMR data. They also provide data for just Fixed-Float AUD IRS – also excluding OIS and Tenor Basis. It’s important to establish at the beginning that we are comparing like-for-like here – see cell J201 in the xls for the fact-checkers out there!
Please note:
- This is a somewhat “stylistic” representation of the data. CCPView figures are taken as an actual monthly time-series, starting October 2014. AFMR figures are taken as an average monthly time-series, starting July 2014.
- Unfortunately, AFMR provide only a single data point on cleared vs uncleared transactions – the annual percentage-split of cleared vs uncleared swaps as a percentage of Turnover:
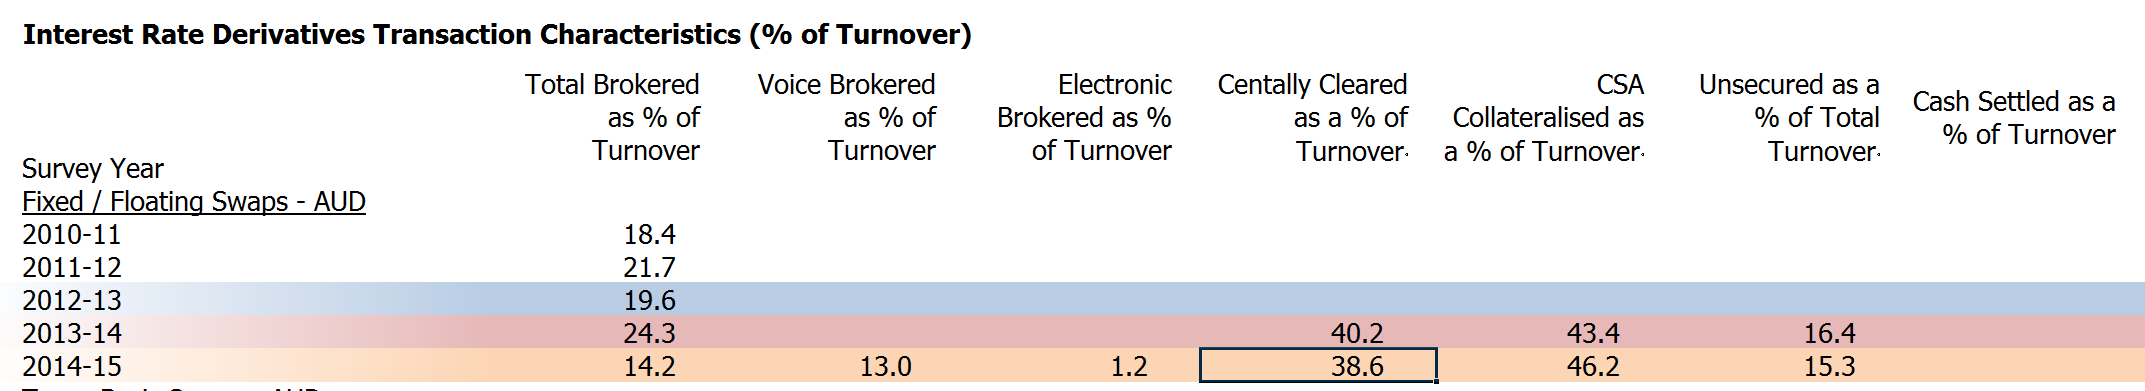
- This percentage split (38.6%) seems very low.
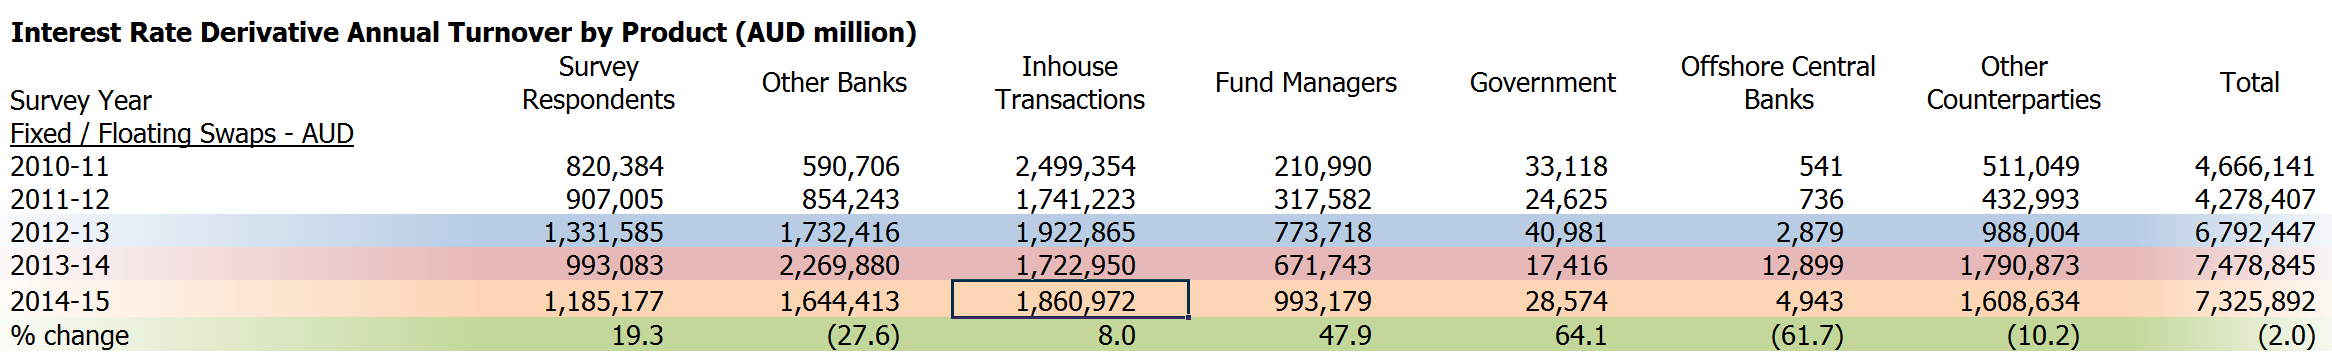
- This may be due to the large proportion of “Inhouse Transactions” included within the AFMR survey:
- But even assuming these Inhouse transactions do not go through clearing, we would still only see a ~52% ratio of cleared to uncleared transactions. Which still seems low.
- We can see that CCPView covers an annual turnover of Cleared, AUD IRS swaps of A$ 4.6trn.
- AFMR survey reports an annual turnover of A$7.9trn (again, for vanilla, fixed-float AUD IRS excluding OIS and Tenor basis).
- They also report a cleared percentage of 38.6% for Fixed-Float AUD swaps – i.e. a total cleared universe of A$2.8 trn, excluding FRAs, OIS and Tenor Basis.
- CCPView therefore covers a swaps Universe that is more than 1.6 times larger than the AFMR survey.
- This is because we look at all Clearing House data, irrespective of geography and/or jurisdiction. Remember that the AFMR survey looks at business with an on-shore presence (whether arranging, risk managing or booking the transaction).
Of further interest, AFMR therefore report an uncleared annual turnover of A$ 4.5trn. This is just for vanilla, Fixed-Float swaps in AUD (excluding OIS). A$ 1.86 trn of this may be accounted for by Inhouse transactions.
But let’s try and have a look at this area of the market in more detail as that still leaves an annual turnover of A$ 2.64trn in uncleared vanilla AUD IRS!
Uncleared Coverage
As we can see from the previous chart, the uncleared portion of the market continues to be a significant portion of the AUD IRS space in the onshore- focussed AFMR survey.
However, if we look at the same time period in SDRView, we see a different picture:
Showing:
- A total turnover across Cleared and Uncleared swaps of just A$ 1.7trn
- A total cleared turnover of A$ 1.3trn
- The percentage of Cleared transactions is much higher than in the AFMR survey. At 76% it even compares favourably with a mandated-to-clear currency such as USD, which sees 85% of notional cleared across the same time-frame.
- This is the most transparent source of data for Uncleared markets, and covers a turnover of just $400bn – less than a tenth of the turnover reported to AFMR.
- Does SDR data therefore pick up a complementary data-source to the AFMR survey? Namely an offshore market (e.g. US Persons) who choose to clear their swaps?
Let’s look at some whole market statistics to see if this is the case.
The Whole Market
Following on from Amir’s blog in May, we could also have a quick look at the DTCC’s ASIC reports. However, little has changed since our last look. There remains no transaction-level reporting, and not even a split by Cleared vs Uncleared that may help to make sense of the other data sources.
However, LCH do refer to the DTCC GTR data as part of their 2015 review in the AFMR report. So we can (kind of) use this data as well.
LCH write in the AFMR report that they estimate they clear over 80% of the total AUD cleared-swap notional.
We can replicate this number using our Open Interest figures in CCPView:
Confirming on a market-share basis that:
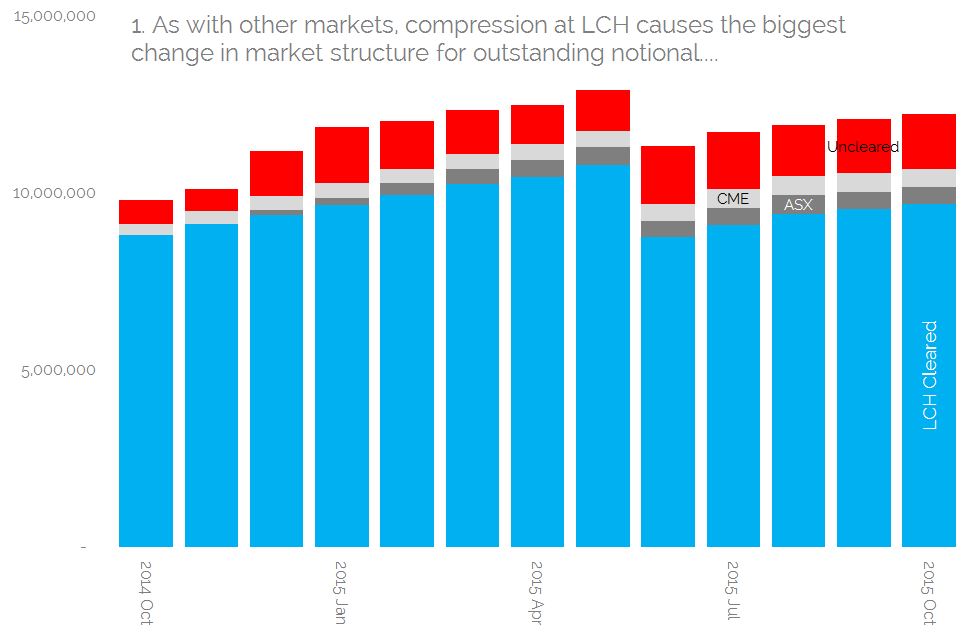
- LCH have a market share, on an Open Interest basis for cleared AUD IRS, of over 90%. That’s mightily impressive for such a mature market! This is slightly different to the figure LCH used as we exclude OIS and FRAs.
- ASX are competing with CME for number two position amongst the clearing venues. Remember this is based on Notional Outstanding, so I’ve intentionally excluded OIS and FRA products.
- These two CCPs account for 5% each of the cleared, vanilla Fixed-Float IRS market.
And giving us some further whole market statistics:
- The implied Uncleared Notional Outstanding is currently A$ 1.5trn (DTCC GTR total minus double the CCPView total notional).
- This is on an outstanding notional basis, and yet is much lower than the AFMR survey data for annual turnover in uncleared AUD IRS.
- The AFMR data therefore must include market participants over and above the DTCC GTR pool of reporting counterparties.
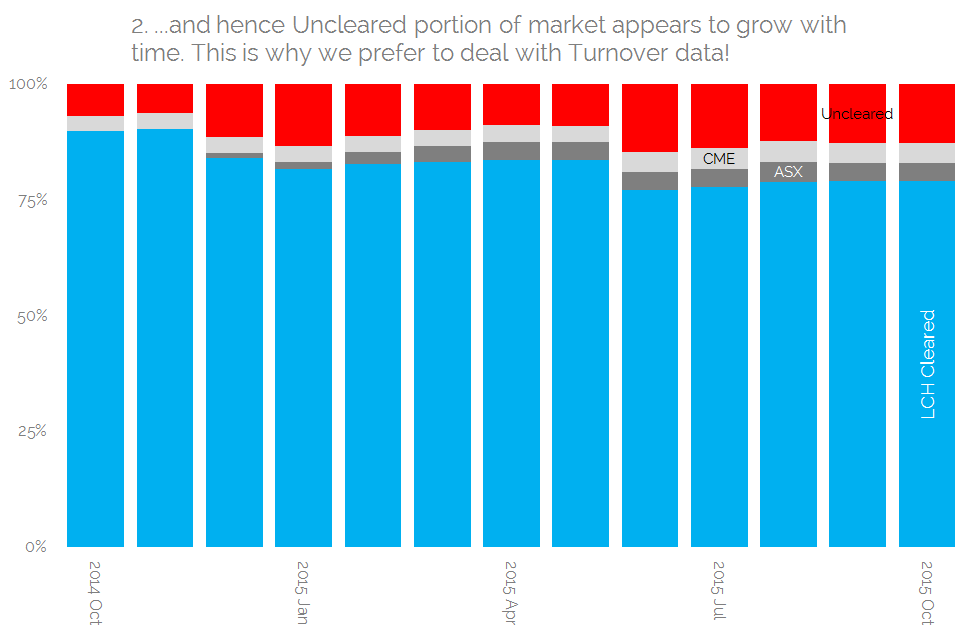
And one other point of note from these charts:
- Look at the impact of Compression at LCH for what happens to the seeming importance of these Uncleared derivatives.
- From making up just 6% of notional outstanding in November 2014, they now make up nearly 13%….
- ….hence why we prefer to look at Turnover data instead!
Onshore vs Offshore dichotomy
So can we simply add the AFMR data to the CCPView or DTCC data? It’s tempting, but I don’t think we’ll ever be able to get a definitive answer to that. My gut feeling says that there must be some overlap – not least from the large Australian swap dealers who report to both.
But the data sources do present some interesting findings. Looking at DTCC & CCPView data, it appears that as much as 85% of the vanilla, fixed-float IRS market is centrally cleared. This is impressive stuff for a market absent a Clearing Mandate….yet.
But, the AFMR survey suggests that only 38.6% of the AUD IRS market is cleared. Now, this is only a single data-point across the whole AFMR survey – which is vast! So I don’t think it was a particular focus of the survey. But it’s still a necessary exercise for diligent market participants to try and reconcile all data sources out there.
As I said previously, one of my thoughts on this difference is due to the inclusion of “In House Transactions” in the AFMR survey data. But excluding these only sees 52% of turnover being cleared.
Therefore, the biggest difference that I can see between our data sources is that CCPView and DTCC are less territory specific than the AFMR survey. Which begs the question:
Is there a structural difference between Onshore and Offshore AUD IRS markets?
This analysis of the data suggests maybe. And in three ways:
- SDRView data (let’s assume this is all US Persons only) shows that 76% of AUD swaps reported to the SDRs are cleared.
- This is broadly consistent with our “whole-world” view from CCPView (cleared) and DTCC GTR (which has data for all AUD swaps, but not split by clearing status per currency).
- The Uncleared turnover data from AFMR suggests an annual volume of uncleared trades up to A$ 4.5trn.
On that last point, our hunch is that there is therefore a vast uncleared market for the buyside in Australia. The fund managers, insurance companies, large corporates and even domestic banks who are yet to start clearing. It’s nice to have an idea of this potential market size, but it’s been quite a journey to deduce that!
I won’t go into the details of trying to tie-in any of our turnover figures with notional outstanding (again) as it typically ends up being futile. Suffice to say, you really need to have a deep understanding of the data you are looking at. Unless…..
Transparency Please
For this blog, I didn’t want to just present the Clarus numbers versus the different data sources out there. I wanted to highlight how opacity can still occur in markets where a wealth of data is published.
This is no criticism of the data or the market associations who put in a lot of time and effort to create this data – which is very much appreciated! This is simply the way of the OTC World in the absence of trade-level, publicly available data.
As I’ve shown, it can still take experienced market participants far too many man hours to weed through the reporting intricacies to make sense of the available data. And this for a market that has a transaction reporting mandate already.
As regular readers will appreciate, Clarus are advocates for transparency in OTC markets.
We are getting there, but we believe that publicly disseminated, transaction level reports are the only way to make sense of OTC derivative volumes. And the AUD IRS market helps show why this is.
The US may have struggled to implement their rules smoothly, but they remain the benchmark for transparency.