- USD SOFR trading on D2C SEFs is very small, and well behind the industry average.
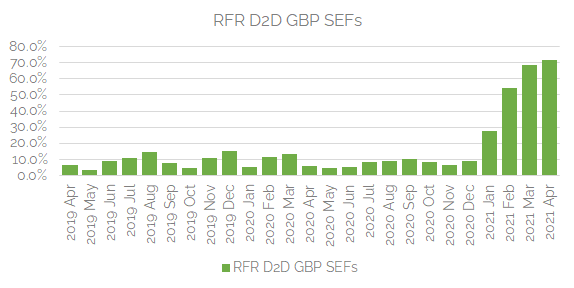
- 72% of GBP risk was versus SONIA on D2D SEFs in April 2021.
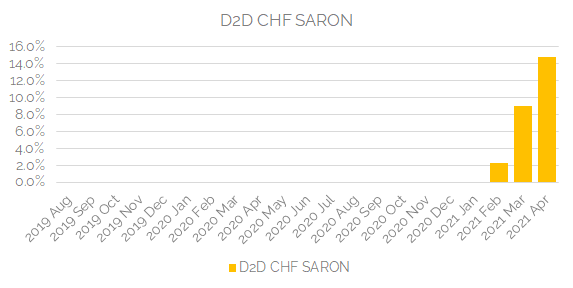
- CHF SARON adoption has jumped to 15% on D2D SEFs this month.
RFR Adoption Indicators
In this blog I turn the RFR Adoption Indicator methodology onto SEF volumes.
For those unfamiliar with the RFR Adoption Indicator (where have you been and what have you been doing?) here is a low-down of what it is:
- The ISDA-Clarus RFR Adoption Indicator tracks how much global trading activity (as measured by DV01) is conducted in cleared over-the-counter and exchange-traded interest rate derivatives (IRD) that reference the identified risk-free rates (RFRs) in six major currencies.
- It covers cleared trading in AUD, CHF, EUR, GBP, JPY and USD.
- Cleared volumes are bucketed into particular maturities on the curve and a standardised DV01 is calculated for each bucket. This allows us to translate tenor-level notional amounts into DV01.
- The indicator covers 8 CCPs across both OTC and futures markets.
The full whitepaper covering the methodology is available from the ISDA website here.
The RFR Adoption Indicator is calculated using DV01s so that it provides an accurate reflection of the trading activity in RFRs. DV01 is a maturity-agnostic measure of risk and it is not inflated by short-dated, large notional trades that have traditionally been the preserve of OIS markets.
Replicating the RFR Adoption Indicator
The indicators are very simple calculations, taking the total DV01 traded in RFRs and dividing it by the total DV01 traded. Amir has covered how this can be achieved using our precise methodology here.
The simplicity allows us to extend the Adoption Indicator methodology to all of our data products. All Clarus data products (SDRView, SEFView and CCPView) include DV01 calculations. RFR Adoption Indicators are now at your finger tips via our data products.
Read on to see what I discovered about SEF markets and RFR trading.
RFR Adoption Indicator for SEFs
Using SEFView, I can run the RFR Adoption Indicator “natively” within our data app:
Showing;
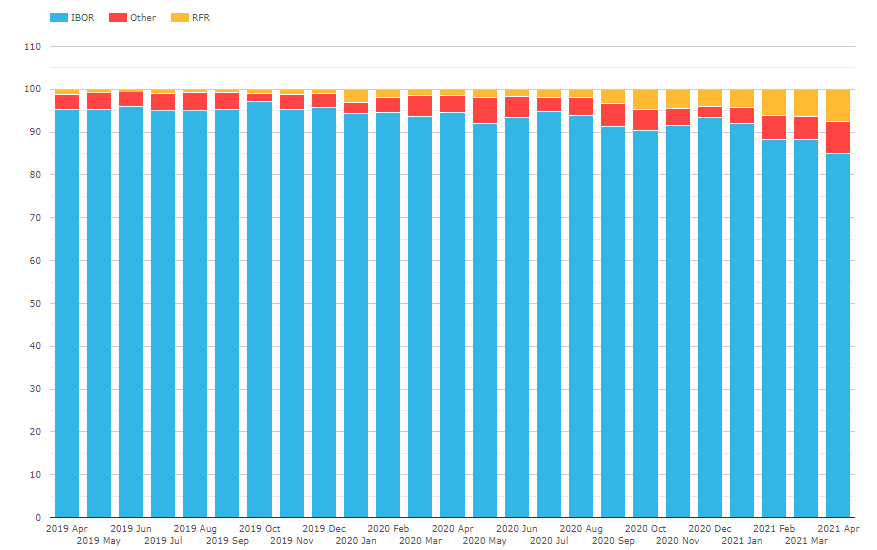
- The RFR portion of the market is shown in orange. The red represents “other” legacy indices such as Fed Funds and EONIA. The blue bars show the proportion of the market traded versus an IBOR.
- All calculations are in DV01.
- 6.2% was the value of the SEF-only RFR Adoption Indicator for March 2021.
- This has risen to 7.6% so far in April 2021.
- Both of these vales are highs for the SEF markets so far.
- However, they are somewhat below where the overall RFR Adoption Indicator lies for global markets. Recall that March 2021 saw an 8.8% reading.
SEF markets are running (slightly) behind the global market. Interestingly, this time-series of data has been more stable and shows a more even evolution than the global markets. There wasn’t even a particular spike in October 2020 for SEF traded RFR risk related to the big-bang discounting switch. Intriguing.
USD SOFR on SEF
As we know from the overall Adoption Indicator, there is a big difference between currencies in terms of RFR adoption. This is probably best shown in the USD market.
The SEF market is fragmented into D2D and D2C trading venues. If we look at just the D2D market in SOFR trading, we see the following adoption:
Showing;
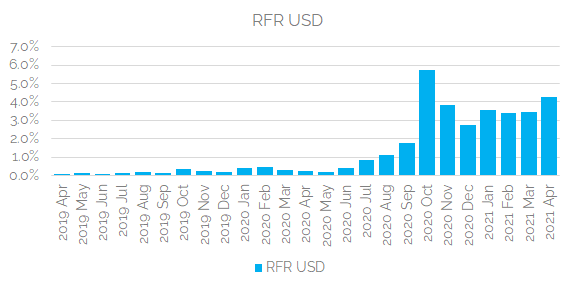
- 4.3% of all USD risk executed on D2D SEFs has been versus SOFR so far in April 2021.
- This is higher than the 3.5% seen in March 2021.
- Again, this is lower than the global average we see from CCP data. Recall in March 2021 that 4.7% of all USD risk cleared in the global market was versus SOFR.
- The D2D SEF community are somewhat lagging the overall market.
However, it is extremely interesting to see SOFR activity on D2C SEFs:
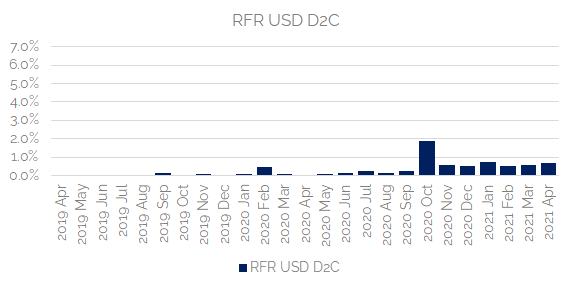
Whoah! There is almost no trading of SOFR on D2C SEFs. Just 0.7% of USD risk is currently versus SOFR in D2C trading. Even the highs were only 1.9% back in October 2020.
Amazing that we see such a divide in USD between Dealer and Client market segments.
GBP SONIA on SEF
GBP markets have been the most successful in terms of RFR adoption so far. The overall GBP indicator is at about 45%. How do SEF markets compare?
First up, SONIA trading on D2D SEFs:
Showing;
- A big bravo to the IDB GBP markets in terms of SONIA adoption.
- 72% of GBP risk has been versus SONIA in April 2021!
- This has trended sharply higher since December 2020.
- This is the first market where we can see a total transformation of risk traded.
What about D2C SONIA markets?
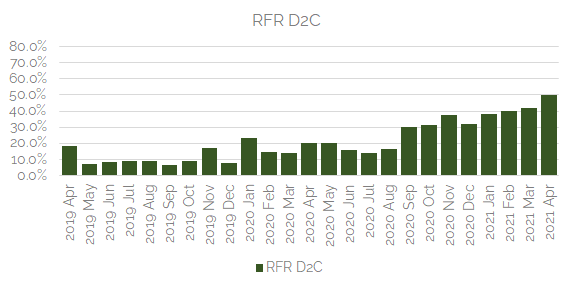
Showing;
- A still impressive showing.
- 50% of GBP risk traded on D2C SEFs has been versus SONIA in April 2021 so far. This is about on-par with the overall global market.
- However, it is worth noting that the GBP D2C market on SEF is much much larger than the D2D on-SEF market.
- The amount of SONIA risk being traded on D2C SEFs is actually much larger, in absolute terms, than we see on D2D SEFs:
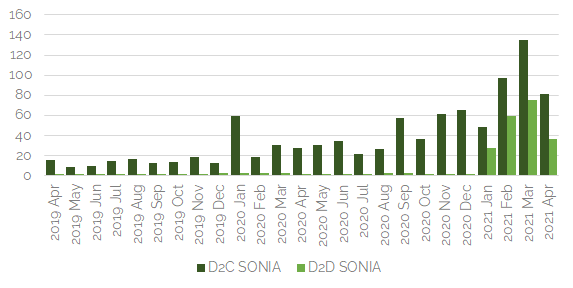
The chart is interesting as it shows that D2C SONIA markets have always existed on-SEF, whilst there was almost no D2D SONIA trading before 2021. Since the turn of the year, D2C SONIA markets have grown, reaching $135m in DV01 traded during March 2021. The growth in D2D SONIA markets on SEF has been even more impressive, reaching $75m in DV01 from virtually nothing. This is probably the twin effect of Brexit and RFR adoption being felt in SEF markets.
Other RFRs on SEF
An honorable mention at this point to CHF. SARON, the CHF RFR, has seen a marked increase in trading on D2D SEFs in just the past two months. This was the exact behaviour we expected to see after the pre-cessation announcement. Somewhat bizarre that it is only CHF behaving “as expected” in this respect:
Activity remains very small in EUR and JPY, to the extent that I won’t even put any charts up for these two! Suffice to say, they have some catching up to do….
In Summary
- Total RFR adoption across SEFs is somewhat lower than the global market.
- We see markedly different adoption across currencies, just as we do for the global market.
- There are even differences between D2D and D2C SEFs.
- RFR adoption is greater in D2D markets in USD, GBP and CHF than in D2C markets.
- However, the largest absolute amount of RFR risk traded on SEF is on D2C GBP SEFs.
Very useful and insightful analysis.