Now seems like the right time to call an end to the regular series of blogs that we have been writing about the ISDA-Clarus RFR Adoption Indicator. Consider today’s blog your “cut-out and keep” guide to one of the biggest changes the derivatives industry has ever witnessed.
A Brief History
The Indicator was first published in July 2020, with ISDA stating at the time:
The indicator, developed in conjunction with Clarus Financial Technology, will provide a monthly snapshot of RFR trading activity in interest rate derivatives (IRD) markets, based on global cleared over-the-counter and exchange-traded derivatives data from seven central counterparties spanning six currencies. The indicator is intended to help derivatives market participants keep tabs on progress to shift to RFRs ahead of the end of 2021, when the UK Financial Conduct Authority will no longer compel or persuade banks to make LIBOR submissions.
ISDA Launches Risk-free Rate Adoption Indicator, see here
It was born out of a common belief that tracking the adoption of RFRs was critical for transition efforts. Talking to market participants, including some global banks, most wanted to be “close followers” to the overall trend. To do so, they needed reliable data.
From the outset, the intention was to monitor trading across both swaps and futures using DV01 metrics. That meant we were not worried if only futures transitioned, or only swaps. The Adoption Indicator would consistently be a fair representation of trading activity.
Expansion
Whilst most LIBORs would cease at the end of 2021, ICE announced in late 2020 that USD LIBOR publication would continue until June 2023. After many consultations, CCPs and exchanges did not convert any USD LIBOR contracts into SOFR until the second quarter of 2023. It therefore made sense to extend the life of the Adoption Indicator past these dates.
Almost inevitably, more ‘IBORs made cessation announcements during the lifetime of the RFR Adoption Indicator. CAD and SGD were large enough markets to warrant adding to the Adoption Indicator at the end of 2022/beginning of 2023.
Notably, two of the “OG” currencies – AUD and EUR – have seen no cessation announcements. Indeed, with €STR consistently making up around one third of EUR Rates risk, the European RFR Working Group has recently been disbanded.
History per Currency
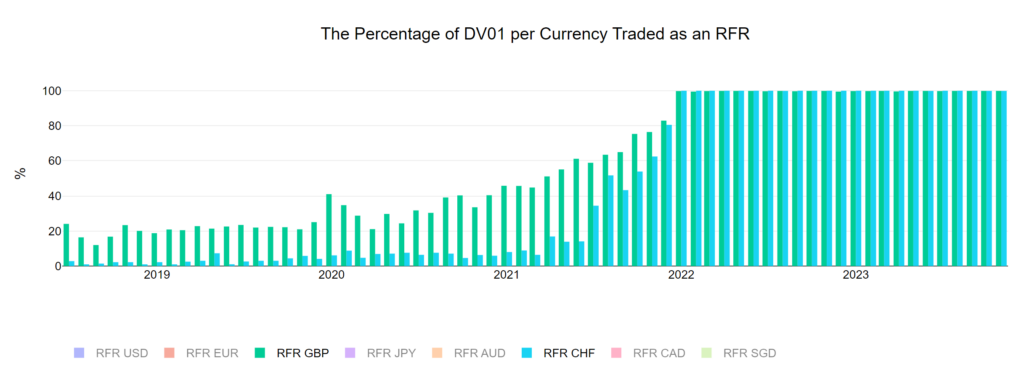
The evolution of RFR Adoption was largely dictated by regulatory deadlines. GBP SONIA adoption saw the most gradual adoption cycle:
- In June 2020, about 25% of risk was traded versus SONIA in GBP Rates derivatives.
- In the next six months, this increased to 46% at the beginning of 2021.
- However, in November 2021 there was still only 76% of risk versus SONIA.
- In December 2021, the final month of GBP LIBOR, 83% of risk was versus SONIA.
Whilst CHF SARON saw the latest transition:
- In June 2021 there was less than 15% of risk traded versus SARON.
- In November 2021, there was still only 62% of risk traded versus SARON.
- There was a large jump from 80% to 100% as a result of the CCP conversion exercises in December 2021 and the final cessation of CHF LIBOR.
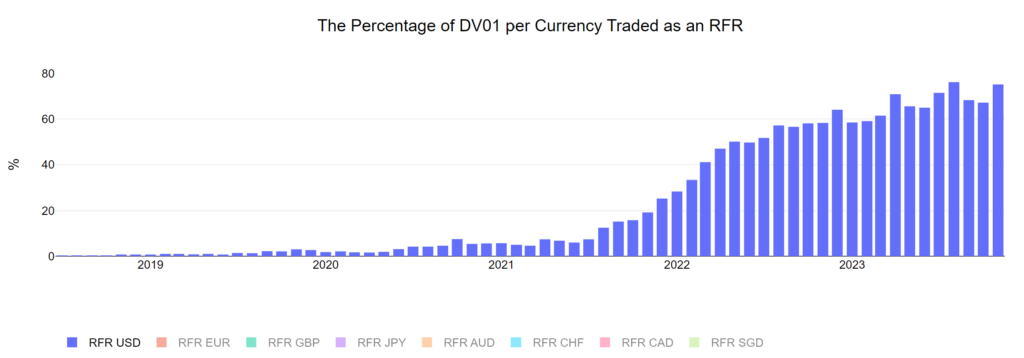
In terms of USD SOFR adoption, USD Rates were consistently the largest constituent of the Adoption Index until USD LIBOR cessation.
- In June 2021 there was less than 6% of risk traded versus SOFR in USD Rates markets.
- In November 2021, there was still only 25% of risk traded versus SOFR, despite new LIBOR-based business being limited by banking regulators from 2022.
- In January 2023, six months prior to USD LIBOR cessation, there was 58% of activity versus SOFR. Much of the remaining activity was versus Fed Funds.
- Following SOFR conversion exercises in April 2023, SOFR adoption jumped to 70.9%.
- It reached 76.2% in August 2023, an all time high.
- SOFR adoption has since been volatile, with the relative proportion of the market trading versus Fed Funds variable month on month.
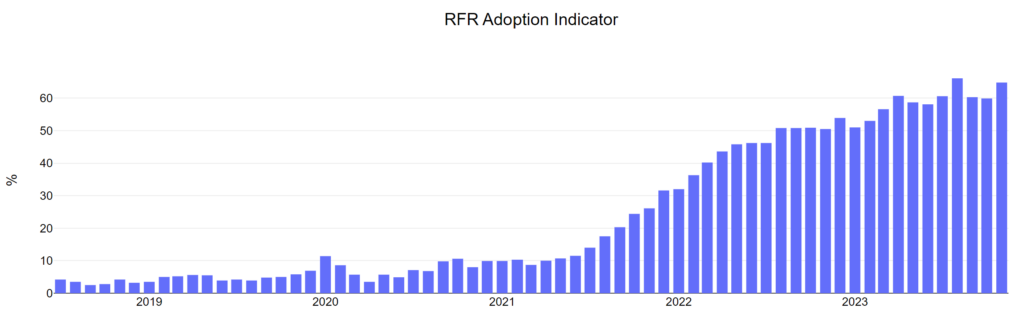
Overall History
Away from currency-specific dynamics, the overall value of RFR Adoption in the market was driven by the relatively large size of USD and EUR Rates markets compared to the other currencies.
- In June 2020, the main RFR Adoption Indicator stood at just 4.9%.
- In November 2021, as the first wave of LIBOR cessation approached, it was at 26%.
- In January 2022 it was still only at 32%, despite CHF, GBP and JPY LIBOR cessation.
- SOFR adoption then drove the indicator gradually higher throughout 2022. The RFR Adoption Indicator was at 54% in December 2022.
- The indicator increased to over 60% in April 2023 as USD LIBOR positions were converted across futures and OTC.
- The high point for RFR Adoption, at 66%, came immediately after USD LIBOR cessation in August 2023.
Continued Development
Recent history of the RFR Adoption Indicator has been driven by two market dynamics:
- In USD Rates, the persistence of Fed Funds trading has been notable. With the Fed actively adjusting their monetary policy outlook, we have had a volatile mix of activity between Fed Funds and SOFR rates.
- In EUR Rates, the persistence of an IBOR rate has led to this becoming the largest traded Rates market, larger than USD. With no regulatory mandate pursuing the cessation of EURIBOR, the proportion of risk traded versus €STR tends to be volatile.
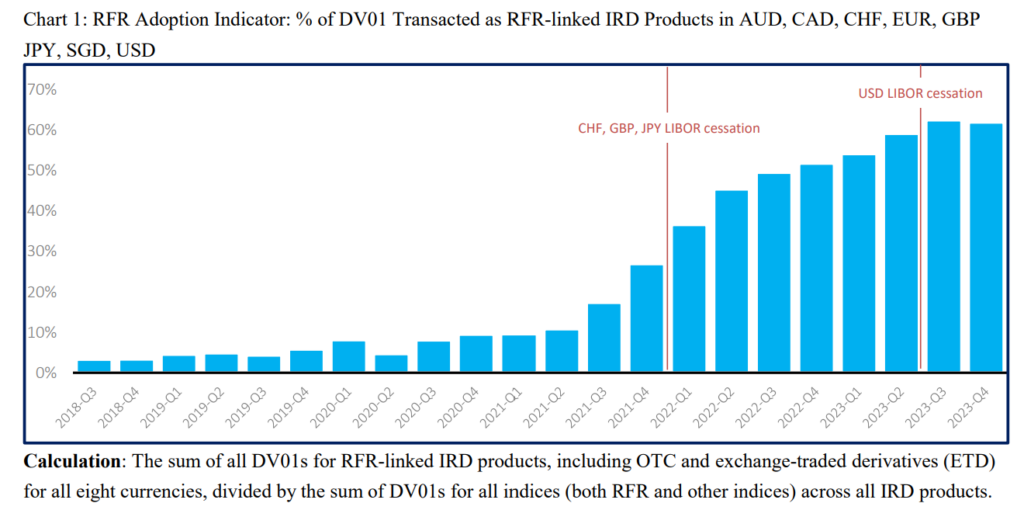
Rather than focus on the particularly volatile nature of month-on-month RFR Adoption after USD LIBOR cessation, it is notable that adoption is stable when considered on a quarterly scale.
Final Remarks
RFR Adoption is a long-term feature of trading and market structure, with change being slow and subject to monthly variations.
An RFR-only world offers simpler and more transparent data, which is in the general best-interests of all market participants.
It has been quite a journey to get where we are today. We would like to thank ISDA for partnering with us and to highlight that the Clarus blog will continue to check-in on the data from time to time in the future.