What is the size of the Uncleared IRS Market?
We estimate the size of uncleared derivatives markets in 2016 We combine BIS Survey data with our own Clarus CCPView cleared data Vanilla Fixed-Float Interest Rate Swaps account for over $250bn in notional traded every day Despite Clearing Mandates in place, some portion of derivatives markets will remain uncleared Uncleared Derivatives A portion of the Interest Rate […]
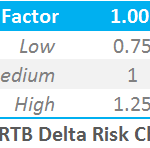
FRTB ‐デフォルト・リスク・チャージ
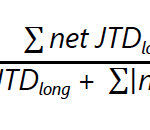
先般の私の記事Fundamental Review of the Trading Book および Internal Models Standardized Approachに続くかたちで、標準的手法で要請されている市場リスク資本、すなわちデフォルト・リスク・チャージ(DRC)の構成要素について見たいと思っていた。
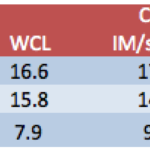
FRTB – Excel Calculator for the Standardised Approach
What is the market risk capital charge for a bank trading an interest rate position? We calculate some examples using the Sensitivities-based Method under FRTB standards We find that a standalone 10y USD IRS results in a market risk capital charge of nearly 10% of the swap notional Fundamental Review of the Trading Book Following […]
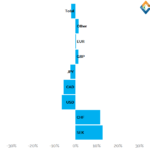
USD Swap Volumes after Nov 8, 2016
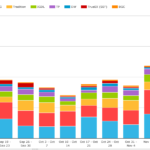
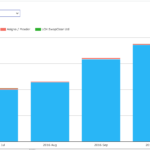
Following on from US Election Live – What is Trading, lets look at USD Swap volumes in the past two weeks. Number of Trades Starting with SDRView and the weekly trade counts reported by US persons. Showing On SEF Cleared USD IRS price-forming: For the eight weeks prior to Nov 7 Averaging 3,700 trades a week Jumping to […]
FCM Rankings – Q3 2016
The most recent quarter of FCM data is out. As usual, I’ve pieced together some updated metrics. If you’ve been keeping up to date with our blogs on this topic, you should remember the running themes: Concentration of business in a handful of firms Any growth in the business has been in swaps European firms shrinking, […]
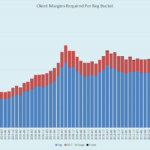
Margin Buffer, Event Risk and the US Election
Following on from my article on Sizing the Margin Buffer for Cleared Swaps I wanted to look at how a margin buffer sized prior to Trump’s US Election win, would have held up on November 9, 2016 and whether such Event Risk should be handled differently. USD Swap Rates We covered the market moves in our […]
Understanding BIS Derivatives Statistics
The BIS publish Semiannual OTC Derivatives Surveys which are complemented by a broad-ranging Trienniel Survey Clarus data, available daily, reconciles to within 2% of these BIS Surveys Our explanation of the data methodology will help anyone interested in market volumes The BIS have a broad-based and narrow list of reporting dealers which can affect the interpretation of data […]
What is a 0x3s FRA?
We look at the mechanics and definitions of a Forward Rate Agreement (FRA) It is the simplest interest rate derivative to price, trade and settle Market conventions tend to be split between Commonwealth currencies and the rest of the world There are many reasons to trade the product, resulting in nearly $10trn per month in volume. […]
US Election Live – What is Trading?
USD Swap curve steepens and volumes massively up, > 5X the average in some tenors. We will follow what is trading in Interest Rate Derivatives markets throughout the day Stay up-to-date by manually refreshing the page today 16:15 New York – Wrapping up for the Day While the Stock Market has been subdued today with […]
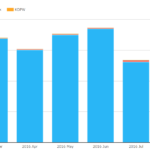
October 2016 Swaps Review
Continuing with our monthly review series, let’s take a look at Interest Rate Swap volumes in October 2016. First the highlights: On SEF USD IRS volume in October at >$1.6 trillion was 12% lower than September SEF Compression activity was $200 billion in USD IRS, same as prior month USD OIS volume at >$1.76 trillion was down from >$2.4 trillion But USD OIS […]