
Bloomberg MTF Data – Week One
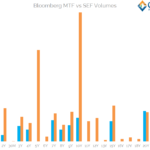
Some MTFs provide weekly aggregated volume data under MIFID II. We examine Bloomberg’s EUR IRS data after the first week. Clarus data shows that out of a global market of €450bn, useable public MIFID II transparency data provides insight into €8bn of the total market. This is beyond disappointing. Dodd Frank data provides more transparency […]
MIFID II – Why ISINs for OTC Derivatives are Bad for Transparency
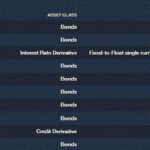
One of the goals of MiFiD II is to improve transparency of price and volume in financial markets and the implementation date of January 3, 2018 finally gave me an opportunity to look at the post-trade data made publicly available by Trading Venues and Approved Publication Arrangements (APAs). This data relies on ISINs for OTC […]
MIFID II Data Day Two

MIFID II Data Day Two Yesterday’s blog was very well received, so we’ve decided to do it again today. We’ll take a look at; Yesterday’s data sources again. Will they work today? Will we get any historical end of day files? Will I finally be able to use some data in Excel? New sources of […]
MIFID II Live Blog – The Data
MIFID II Data is Here! Happy MIFID II day everyone. And happy New Year. We thought it would be a great way to welcome in the dawn of added transparency in European markets with a live blog this morning to see what transparent trade reporting in Europe will deliver to us. Remember to refresh throughout […]
2017 SEF Market Share Statistics
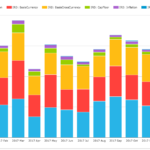
In this article I look at 2017 Swap Execution Facility (SEF) market share for Credit, Foreign Exchange and Interest Rate Derivative asset classes, in a similar format to my 2016 SEF Market Share Statistics. Clarus SEFView has daily volume data published by each SEF, which is filtered, normalised and aggregated to allow meaningful comparison of market share […]