In this article I look in detail at the 2020 volumes and market share for OTC Derivatives in Interest Rates reported by Clearing Houses.
Clarus CCPView has daily volume and open interest data published by each CCP, which is filtered, normalised and aggregated to allow meaningful comparisons of volume and has been used to produce all the charts below.
Table of Contents:
- USD Swaps (LIBOR, OIS, SOFR)
- EUR Swaps (EURIBOR, OIS, €STR)
- GBP Swaps (LIBOR, SONIA)
- JPY Swaps (IBOR, TONA)
- AUD Swaps (BBSW, AONIA)
- CAD Swaps (IBOR, CORRA)
- EMEA Swaps
- AsiaPac Swaps
- Cross Currency Swaps
- LatAm Swaps
Onto the charts, data and details.
Volumes and Market Share
For major currencies and regions, vanilla swaps referencing IBORs and OIS Swaps referencing RFRs. We will use single-side gross notional and cleared volume over a period, either a Year, a Quarter or a Month.
USD Swaps (Libor)
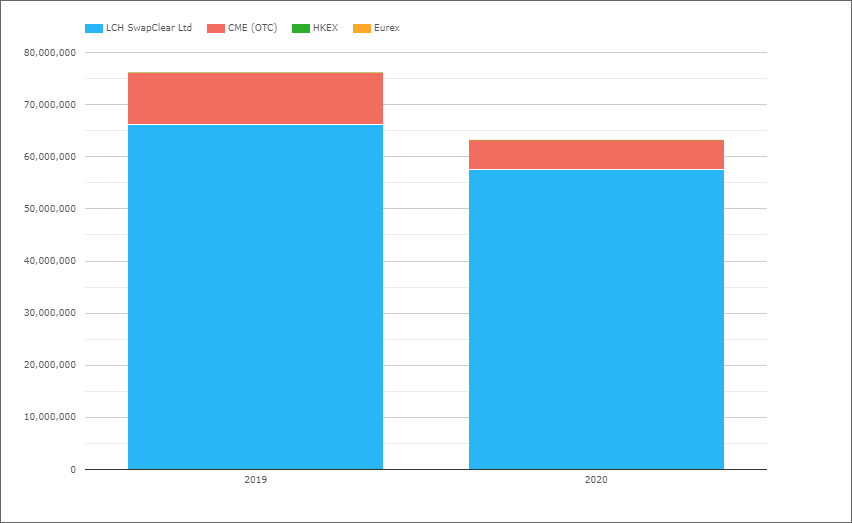
- 2020 with $63 trillion compared to $76 trillion in 2019, a decrease of 17%
- LCH SwapClear with $57.5 trillion in 2020 and $66 trillion in 2019
- CME OTC with $5.7 trillion in 2020 and $10.1 trillion in 2019
- 2020 Share is LCH 91% and CME 9%, compared to 87% v 13% in 2019
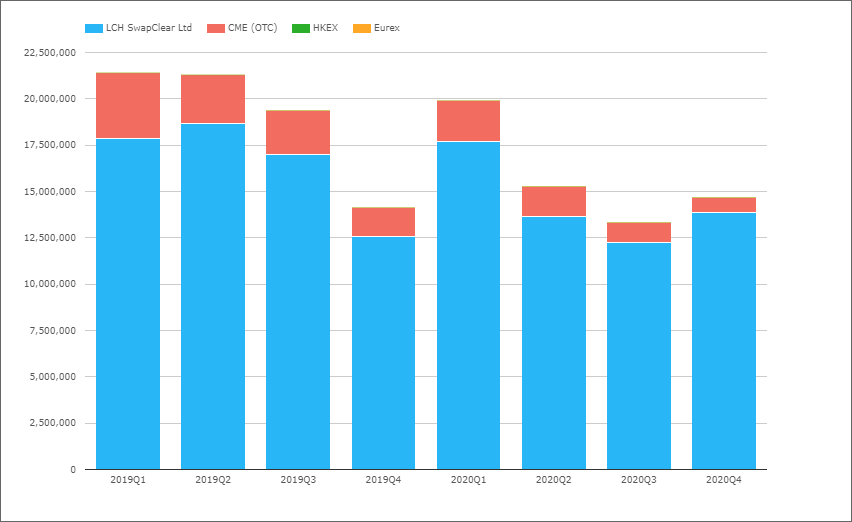
- 2020Q1 with $20 trillion similar to each of the first 3 quarters in 2019
- The remaining 2020 quarters much lower, with $13-15 trillion
- However 2020Q4 higher than 2019Q4, no sign of an IBOR cessation drop-off here
- LCH 2020Q1 share of 89% increasing to 92% in Q3 and 94% in Q4
- CME 2020Q1 share of 11% decreasing to 8% in Q3 and 6% in Q4
- Possibly due to less Client activity which makes up most of CME volume
USD OIS (All)
Primarily referencing Fed Funds, but also others such as SOFR or Prime.
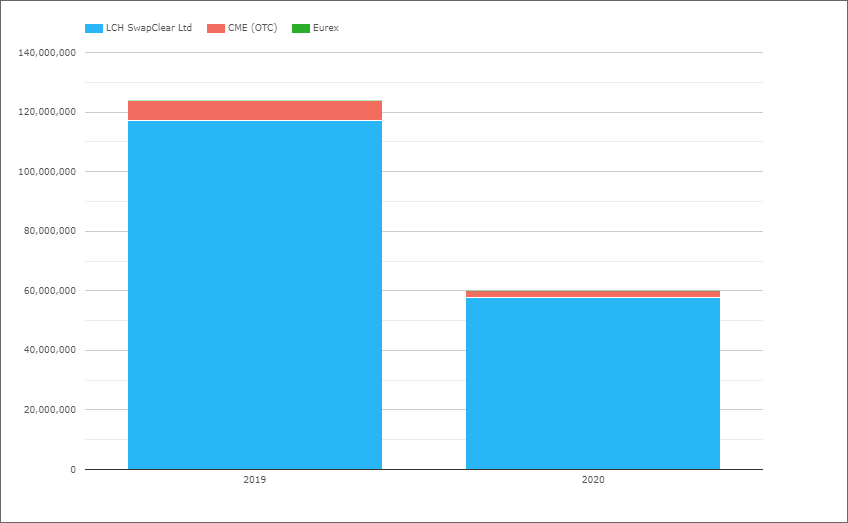
- 2020 with $60 trillion compared to $124 trillion in 2019, a drop of 52%
- LCH SwapClear with $57.7 trillion in 2020 and $117 trillion in 2019
- CME OTC with $2.2 trillion in 2020 and $6.9 trillion in 2019
- 2020 Share is LCH 96% and CME 4%, compared to 94% v 6% in 2019
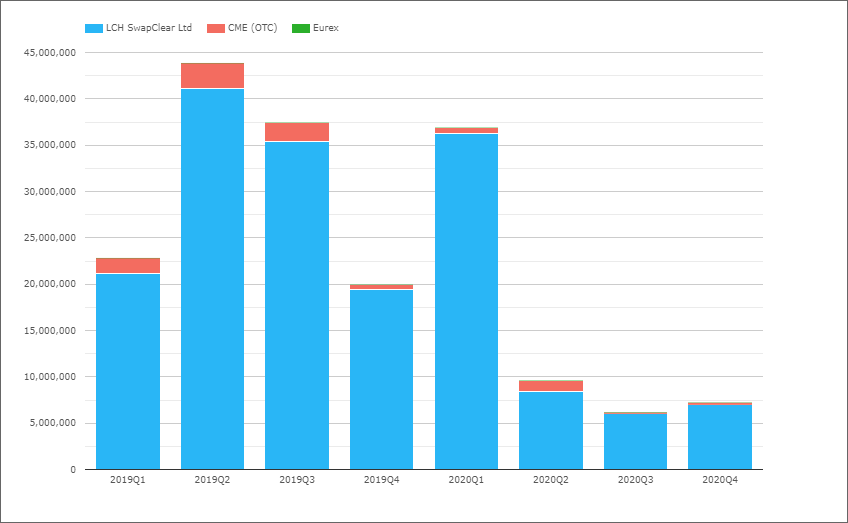
- 2020Q1 with $37 trillion similar to 2019Q3
- The remaining 2020 quarters far lower
- As FedFund Rates are expected to remain un-changed and low
USD Swaps (SOFR)
Next isolating Swaps that reference SOFR, either OIS or Basis.
- 2020 with $2.5 trillion, just 4% of the $60 trillion of OIS Swaps
- But a real pick up October with volumes jumping to $400 billion a month
- Resulting from CCPs changing from FedFunds to SOFR discounting
- LCH SwapClear with $2.1 trillion in 2020, an 87% market share
- CME OTC with $320 billion in 2020, a 13% market share
- It will be interesting to see if early months in 2021 maintain the trend
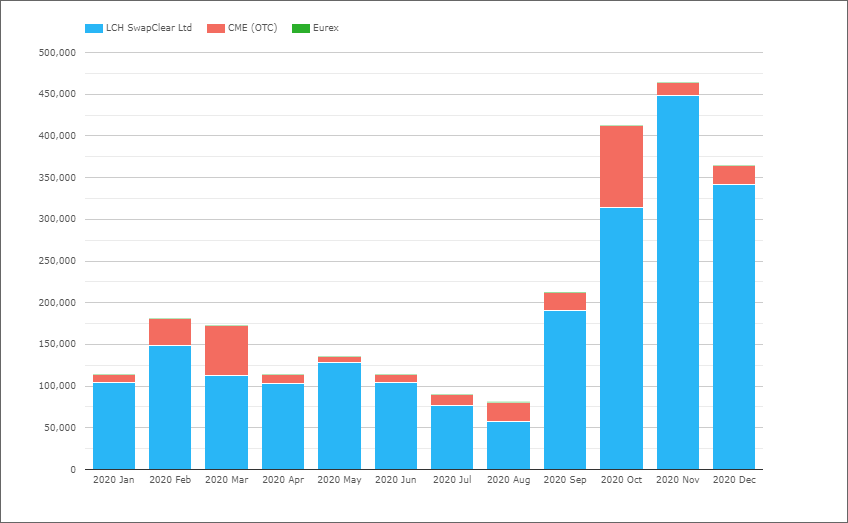
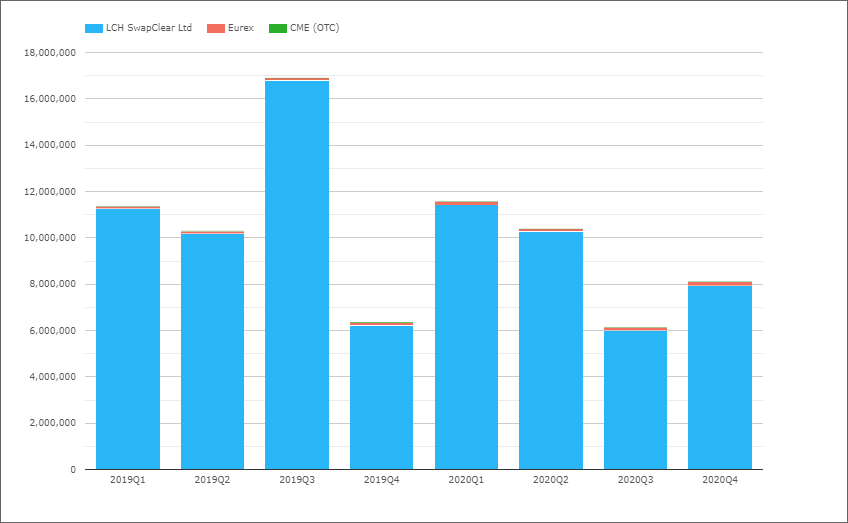
EUR Swaps (Euribor)
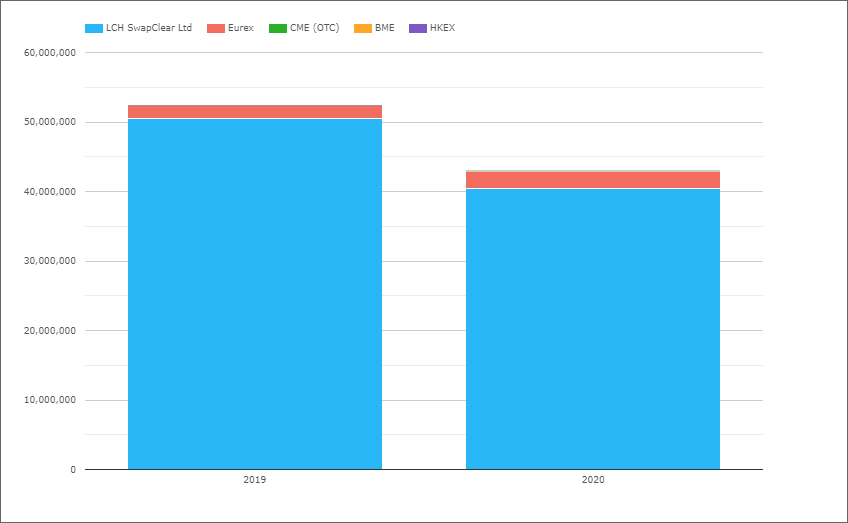
- 2020 with €43 trillion compared to €52.4 trillion in 2019, a decrease of 18%
- The decrease consistent with that seen in USD Swaps
- 2020 EUR Swaps equivalent to $51.6 trillion, similar to USD Swap $63 trillion
- LCH SwapClear with €40.4 trillion in 2020 and €50.4 trillion in 2019
- Eurex with €2.5 trillion in 2020 and €1.86 trillion in 2019
- 2020 market share is LCH 94%, Eurex 5.8% and CME 0.2%
- While 2019 share was 96.2%, 3.5% and 0.2% respectively
- 2020Q1 with €13 trillion, similar to 2019Q3
- The remaining 2020 quarters much lower
- LCH 2020Q1 share of 96% decreasing to 94.3% in Q3 and 89.4% in Q4
- Eurex 2020Q1 share of 3.9% increasing to 5.4% in Q3 and 10.2% in Q4
- Eurex 2020Q4 the first time a quarter exceeded €1 trillion gross notional
- Eurex 2019Q4 share was 7.2%, also much higher than prior 2019 quarters
- CME 2020Q1 share of 0.04% increasing to 0.29% and 0.39% in Q3 and Q4
- Brexit withdrawal agreement and equivalence decisions driving change
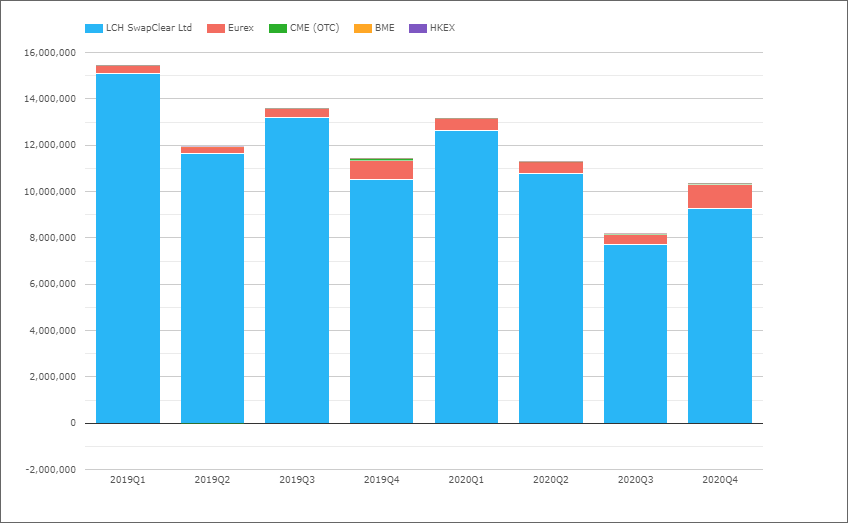
EUR OIS (All)
Referencing either EONIA or €STR.
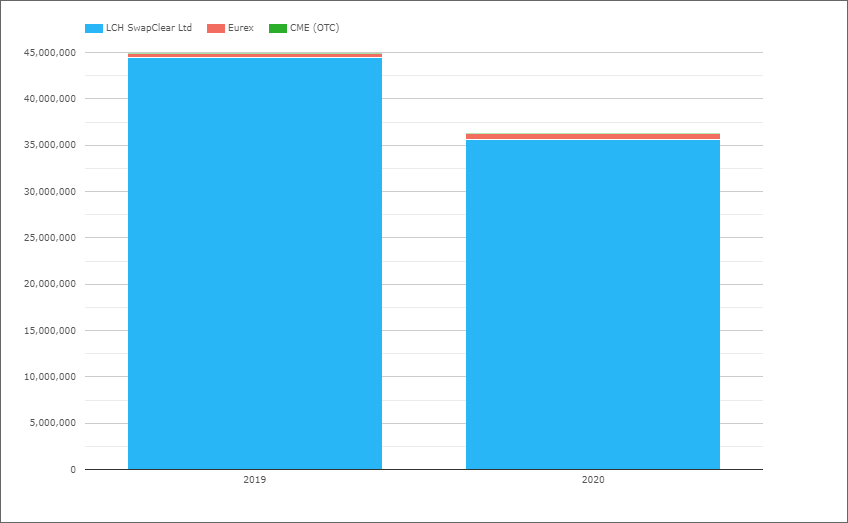
- 2020 with €36.3 trillion compared to €45 trillion in 2019, a decrease of 19%
- So a similar drop to EUR and USD Swaps
- LCH SwapClear with €35.6 trillion in 2020 and €44.4 trillion in 2019
- Eurex with €620 billion in 2020 and €440 billion in 2019
- 2020 market share is LCH 98.3% and Eurex 1.7%
- While 2019 share was 98.9% and 1% respectively
- 2019Q3 with €16.9 trillion by far the highest quarter
- 2020Q1 with €11.6 trillion the highest in 2020
EUR Swaps (€STR)
Next isolating Swaps that reference €STR, either OIS or Basis.
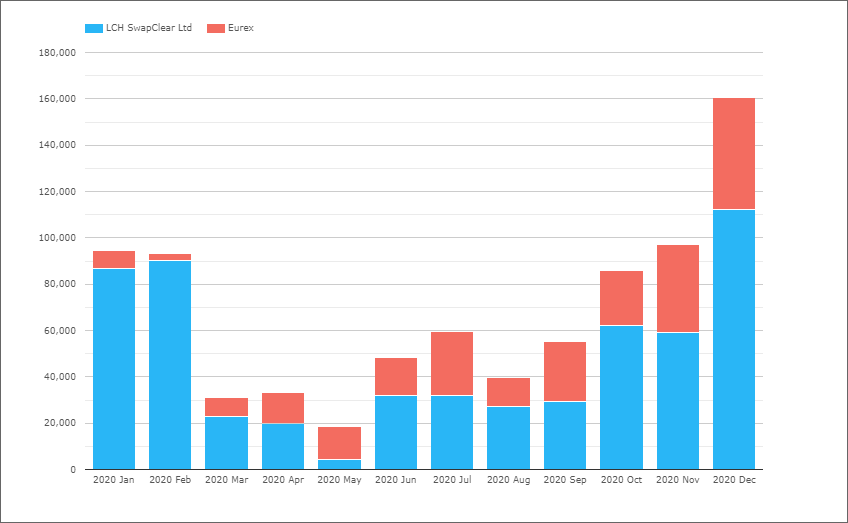
- 2020 with €820 billion, just 2% of the €36.3 trillion of OIS Swaps
- But a real pick up in October with volumes jumping
- As LCH changed from EONIA to €STR discounting end Sep 2020
- LCH with €580 billion in 2020, a 70.7% market share
- Eurex with €240 billion in 2020, a 29.3% market share
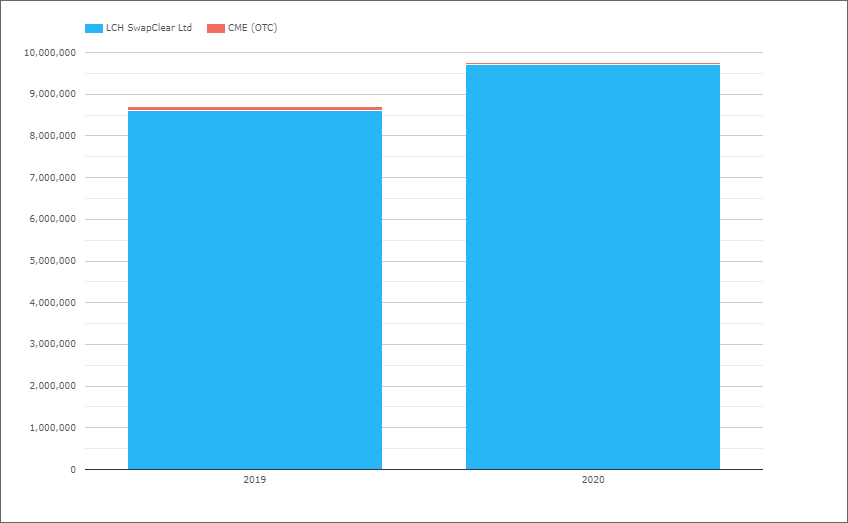
GBP Swaps (Libor)
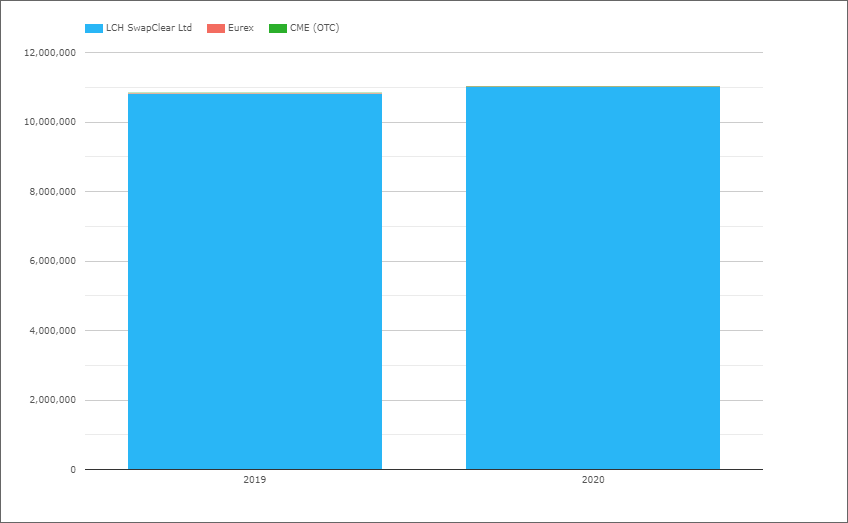
- 2020 with £11 trillion compared to £10.9 trillion in 2019, a small increase of 1.7%
- So very different to the 18% decreases in USD and EUR Swaps
- The 2020 comparative is GBP Swaps $14.8t vs EUR $51.6t to USD Swap $63t
- LCH SwapClear with £11 trillion in 2020 and a 99.8% market share
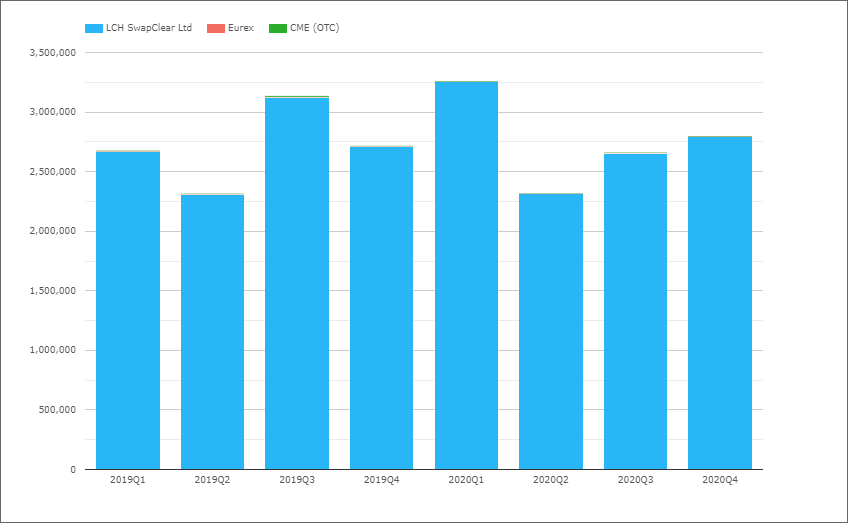
- 2020Q1 with a high of £3.3 trillion
- The remaining 2020 quarters much lower
- However 2020Q4 at £2.8 trillion is higher than 2019Q4 with £2.7 trillion
- No sign of an IBOR cessation drop-off, despite FCA announcements, albeit late in Q4
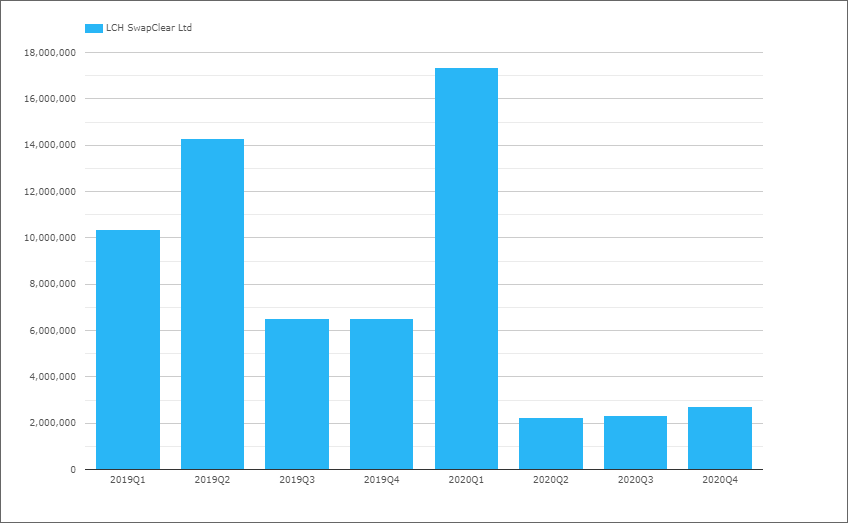
GBP OIS (SONIA)
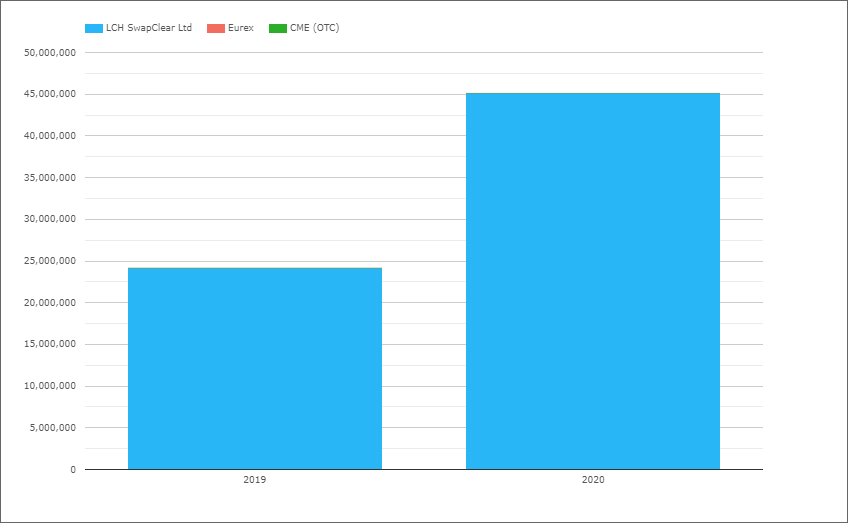
- 2020 with £45.2 trillion compared to £24.2 trillion in 2019, a huge increase of 87%
- LCH SwapClear with 99.99% market share
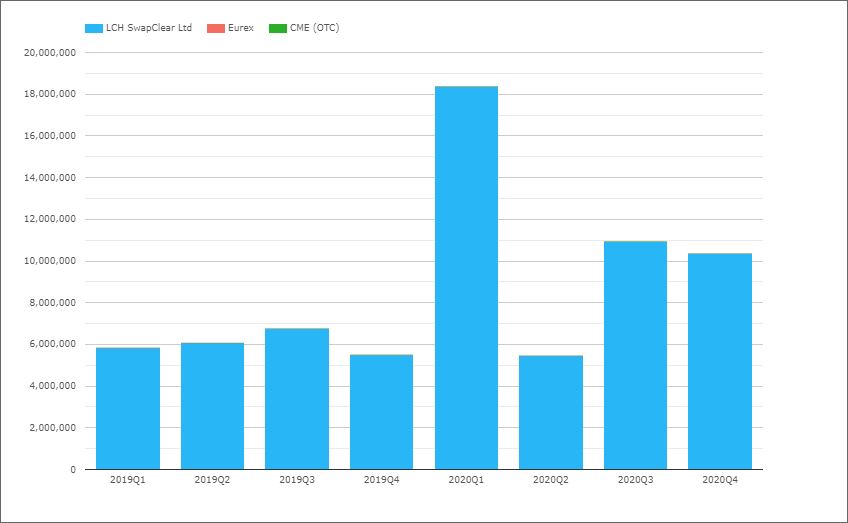
- 2020Q1 with £18.4 trillion by far the highest quarter on record
- 2020Q3 and 2020Q4 also significantly up from 2019
- Good signs for IBOR cessation?
- Or more likely driven by BOE rate expectations
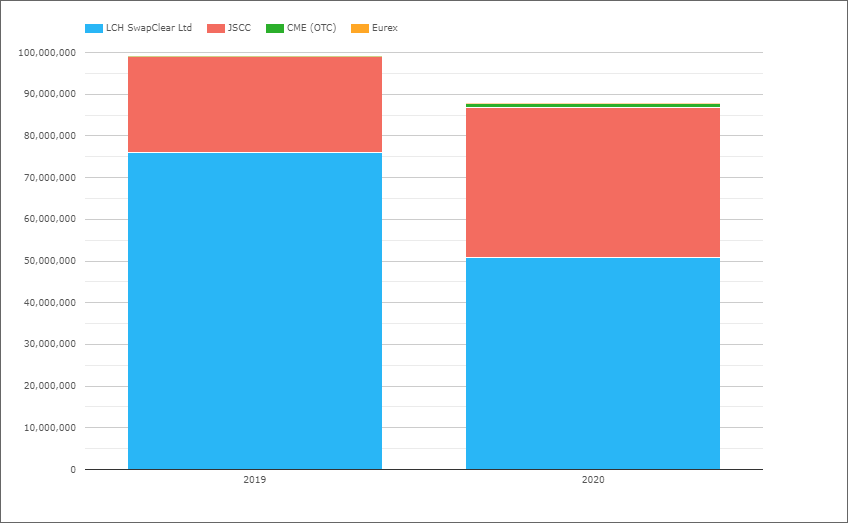
JPY Swaps (IBOR)
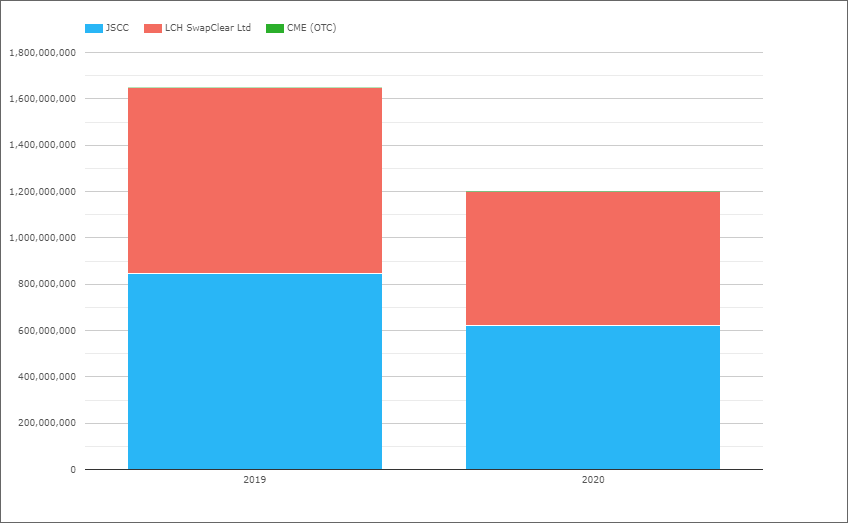
- 2020 with Y1,200 trillion compared to Y1,650 trillion in 2019, a decrease of 27%
- In USD terms the 2020 volume is $11.2 trillion, so less then GBP Swaps with $14.8 trillion and far less than EUR or USD Swaps
- JSCC with Y620 trillion in 2020, a 51.6% market share
- LCH with Y581 trillion in 2020, a 48.3% market share
- The 2019 share was JSCC 51.3% to LCH 48.6%, so no material change
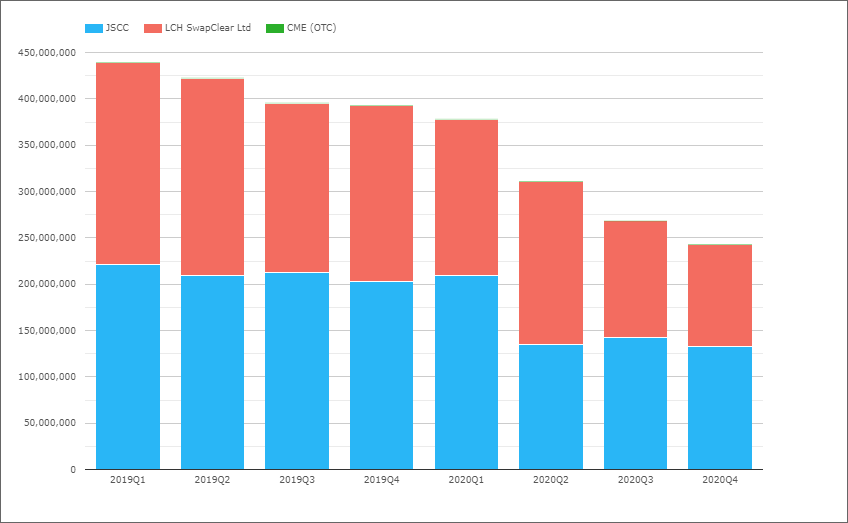
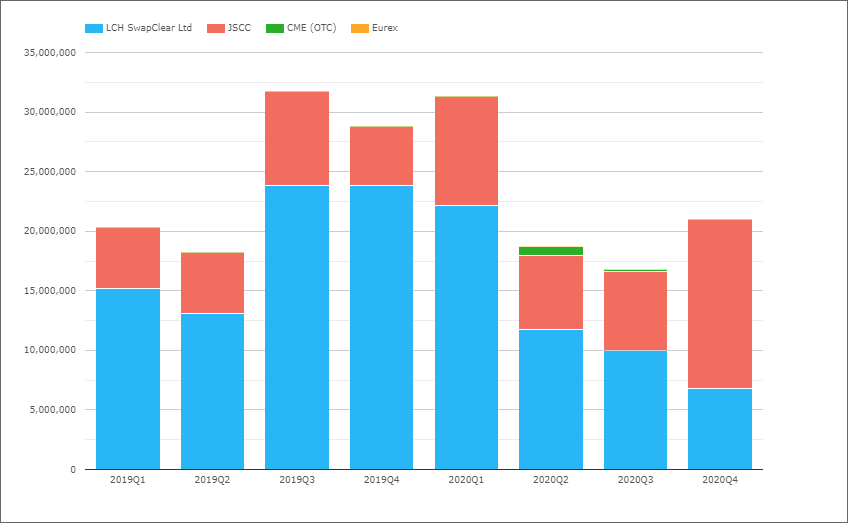
- A marked drop-off QoQ after 2020Q1
- With 2020Q4 volumes 38% lower than 2019Q4
- Activity and use of JPY IBOR Swaps dropping off significantly
- One to look at again in 2021Q1
JPY OIS (TONA)
- 2020 with Y87.7 trillion compared to Y99 trillion in 2019, a decrease of 11%
- JPY OIS volumes just 7% of JPY IBOR Swap volumes
- In USD terms the 2020 volume of Y87.7 trillion is equal to just $820 billion, so tiny compared to GBP, EUR or USD OIS volumes.
- LCH with Y50.7 trillion in 2020, a 58% market share
- JSCC with Y36 trillion in 2020, a 41% market share
- 2019 market share was LCH 77% and JSCC 23%, so JSCC up significantly
- Volumes after 2020Q1 dropping off significantly
- 2020Q4 the first time that JSCC volumes exceeded LCH
- A market share to watch in 2021
AUD Swaps
While BBSW is the IBOR equivalent index and AONIA is the RFR equivalent, we will start with charts combining both vanilla and OIS Swaps as well as Basis, Variable Notional and Zero Coupon. (This is because we do not have public data to share from ASX on the volume split between BBSW and AONIA).
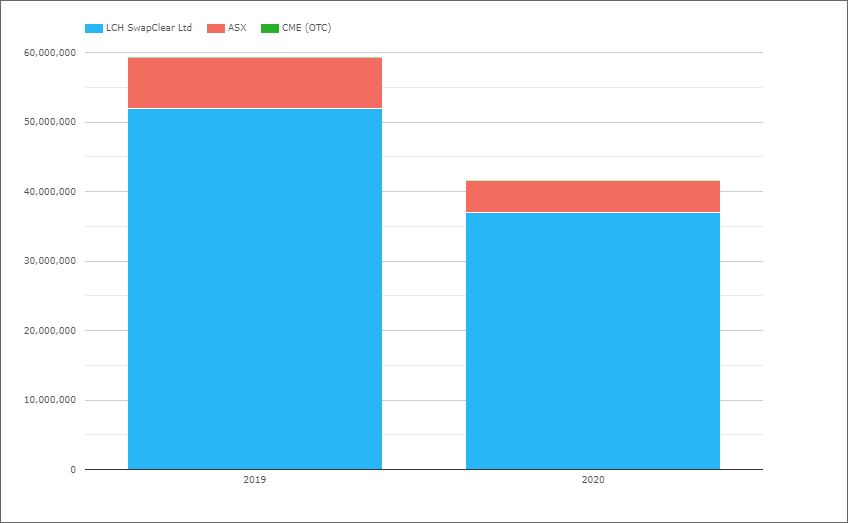
- 2020 with A$41.6 trillion compared to A$59.3 trillion in 2019, a decrease of 30%
- In USD terms the 2020 volume is $28 trillion, so less than GBP Swaps & OIS combined of $73 trillion but much higher than JPY Swaps & OIS of $12 trillion
- LCH with A$37 trillion in 2020, an 89% market share
- ASX with A$4.6 trillion in 2020, an 11% market share
- The 2019 share was LCH 87.5% to ASX 12.4%
Next let’s isolate LCH only and Vanilla Swaps referencing BBSW.
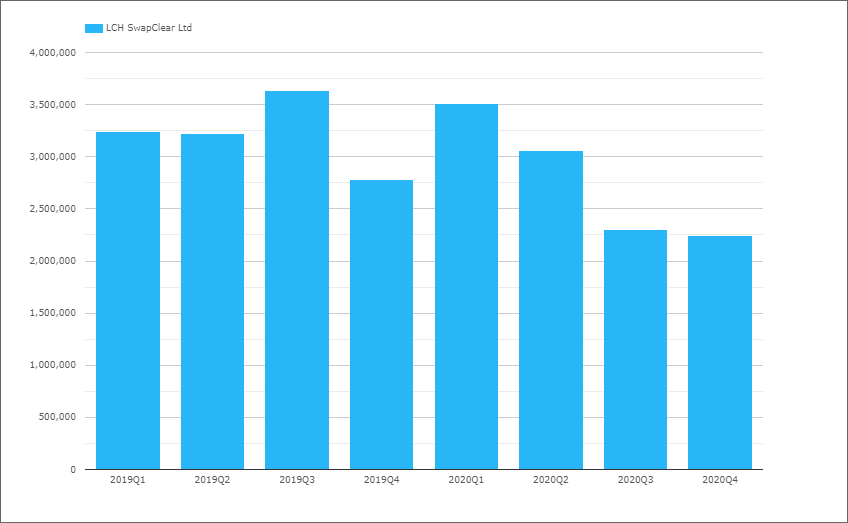
- 2020 Q1 with A$ 3.5 trillion, similar to 2020Q3
- And 2020 FY LCH volume of A$11.1 trillion
- Assuming that 1/3 of the ASX volume of A$4.6 trillion in 2020 is BBSW, we estimate ASX as AS1.53 trillion and derive a market share of LCH 88% vs ASX 12%, so not much different from the 89% vs 11% in the prior section.
- While there is some drop-off in Q3 and Q4, this is likely due to market conditions and nothing to do with IBOR cessation as Australia is a multi-rate environment with a reformed BBSW continuing to be published for the foreseeable future.
Next let’s isolate LCH only OIS Swaps referencing AONIA.
- 2020Q1 by far the highest with A$17.4 trillion, similar to the Covid-19 Crisis peaks we see in other currencies
- The remaining quarters in 2020, far lower with just a A$2.4 trillion average
- And 2020 FY LCH volume of A$24.6 trillion
- Assuming that 2/3 of the ASX volume of A$4.6 trillion in 2020 is BBSW, we still make the share for AUD OIS as LCH 89% and ASX 11%
- While there is some drop-off in Q3 and Q4, this is likely due to market conditions and nothing to do with IBOR cessation as Australia is a multi-rate environment with a reformed BBSW continuing to be published for the foreseeable future.
CAD Swaps (IBOR)
- 2020 with C$9.75 trillion compared to C$8.7 trillion in 2019, an increase of 12%
- So very different to the decreases in USD and EUR Swaps
- The 2020 comparative is CAD Swaps $7.3tn, GBP Swaps of $15tn, AUD Swaps of $9.8tn
- LCH SwapClear with C$9.7trillion in 2020 and 99.5% market share
CAD OIS (CORRA)
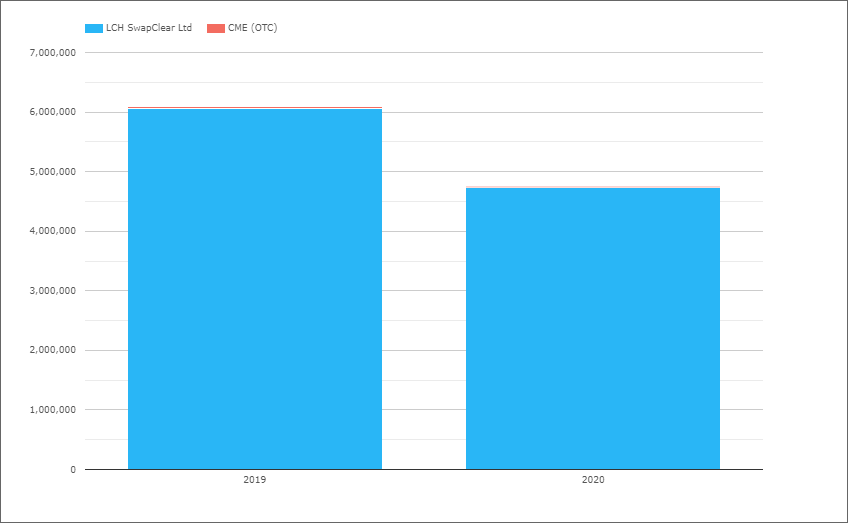
- 2020 with C$6.4 trillion compared to C$8.1 trillion in 2019, a decrease of 21%
- CAD OIS in USD of $4.75tn much smaller than AUD OIS of $21.5tn
- LCH SwapClear with 99.7% market share
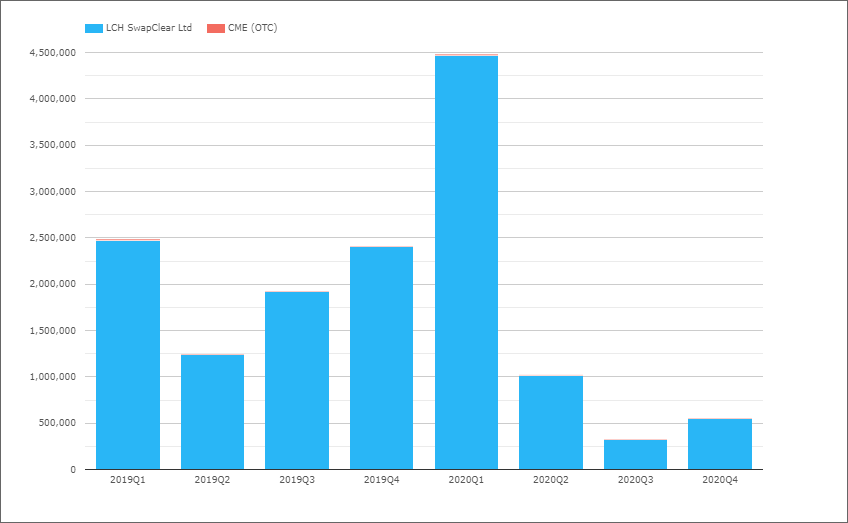
- 2020Q1 with by far the highest volume of C$4.48 trillion
- 2020Q1 making up 70% of the full 2020 year volume
- Most likely due to low BOC rate change expectations
EMEA Swaps
Now let’s switch to EMEA Swaps (all types) and volumes by currency.
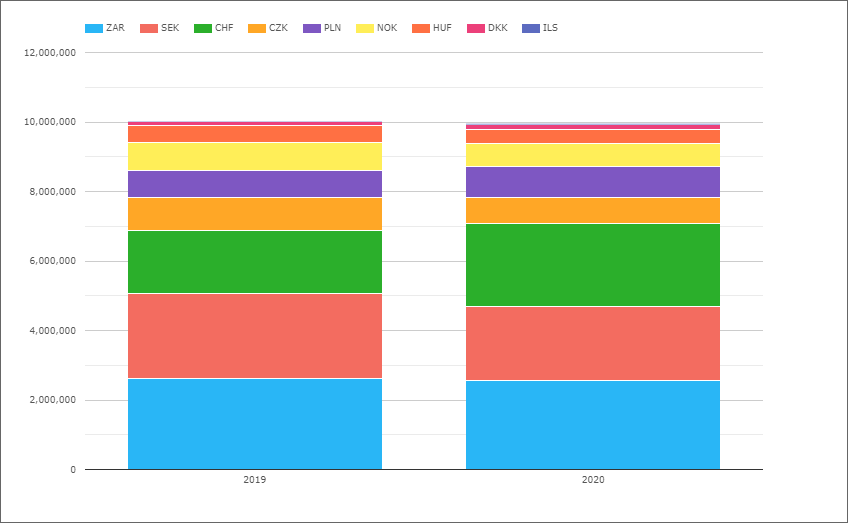
- 2020 with $10 trillion, same as 2019 and comparable in size to CAD Swaps market
- ZAR the largest 2020 currency with $2.6 trillion, similar to 2019
- CHF with $2.4 trillion, up 31% from $1.8 trillion in 2019
- SEK with $2.1 trillion, down 12% from $2.5 trillion
- PLN with $890 billion, up 4% from $795 billion
- CZK with $765 billion, down 18% from $930 billion
- NOK with $660 billion, down 16% from $790 billion
- HUF with $400 billion, down 18% from $485 billion
- DKK with $145 billion, up 10% from $130 billion
- ILS a new currency launched in 2020 by LCH with $30 billion
Not shown in the chart is that LCH SwapClear has 98.3% of the overall EMEA volume. The only currencies where LCH has less than 99% share are:
- PLN, with LCH 91.4%, KDPW5.6% and CME 3%
- SEK, with LCH 95%, Nasdaq OMX 4.8%
- HUF, with LCH 96.3%, CME 3.7%
- CZK, with LCH 96.9%, CME 3.1%
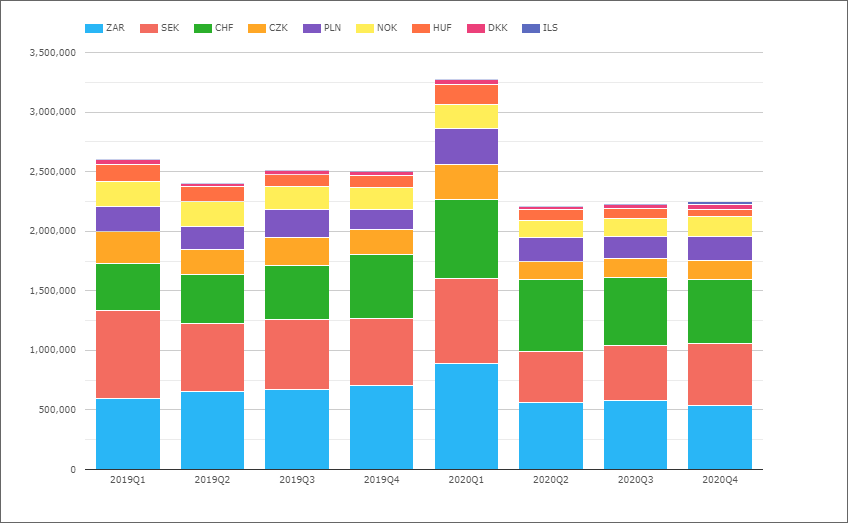
- Each quarter a remarkably consistent $2.2 to $2.5 trillion
- Except 2020Q1 with a high of $3.3 trillion
- Similar to the Covid-10 Crisis quarter volumes we see in other ccys
AsiaPac Swaps
Now let’s switch to AsiaPac Swaps (all types) and volumes by currency.
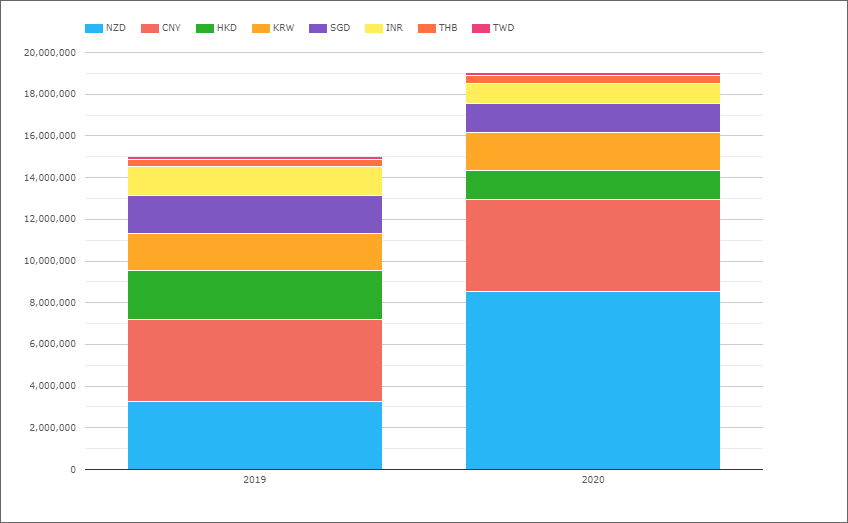
- 2020 with $19 trillion, up from $15 trillion in 2019 an increase of 27%
- NZD the largest 2020 currency with $8.5 trillion, up from $3.2 trillion
- NZD increase due to OIS of $5 trillion in 2020 and only $205 billon in 2019 as a newish cleared product launch by LCH SwapClear
- CNY with $4.4 trillion, up 12% from $4 trillion in 2019
- KRW with $1.81 trillion, up 2% from $1.78 trillion
- SGD with $1.42 trillion, down 22% from $1.8 trillion
- HKD with $1.37 trillion, down 41% from $2.3 trillion
- INR with $970 billion, down 31% from $1.4 trillion
- THB with $355 billion, up 9% from $325 billion
- TWD with $145 billion, up 31% from $110 billion
Not shown in the chart is that LCH SwapClear has 84% of the overall AsiaPac volume. The only currencies where LCH has less than 99% share are:
- CNY, with Shanghai Clearing 61%, LCH 38.8%, HKeX 0.2%
- INR, with LCH 67.1%, CCIL 32.7%, CME 0.2%
- HKD, with LCH 98.1%, HKEX 1.3%, CME 0.6%
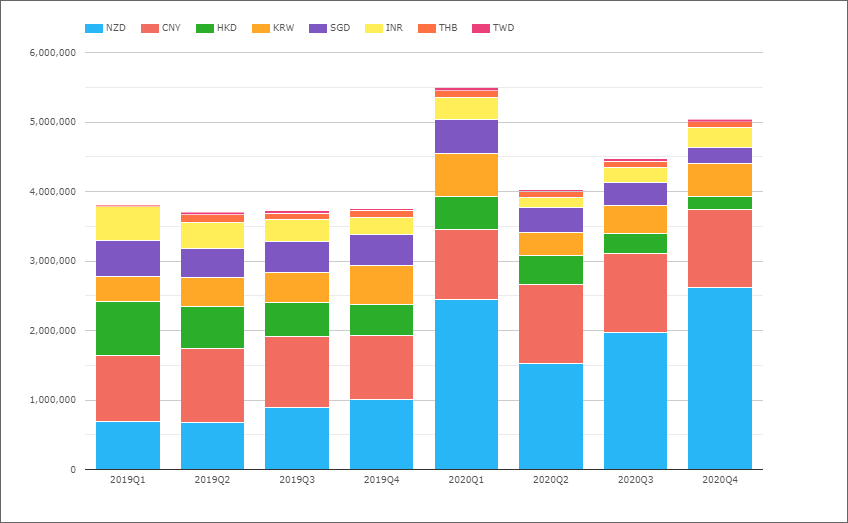
- Each quarter comprable, except for highs in 2020Q1 and Q4
AsiaPac Cross Currency Swaps
HKEX is the only CCP to offer clearing of Cross Currency Swaps, so let’s take a look.
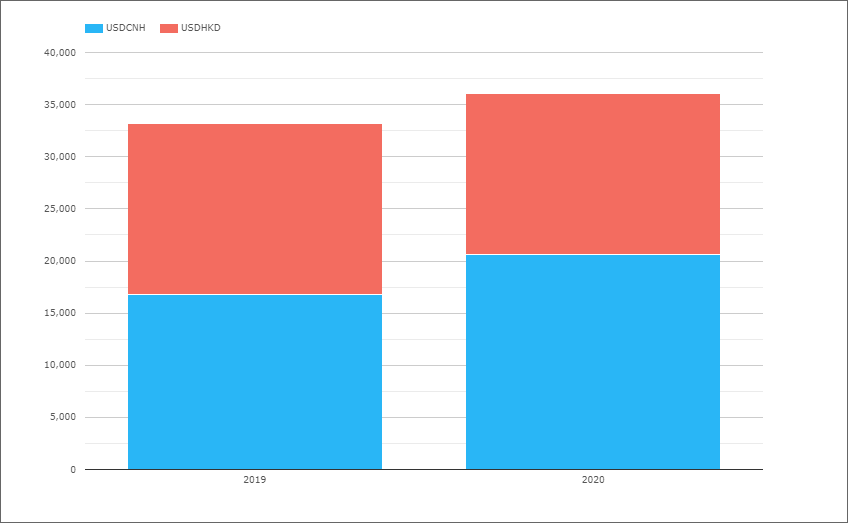
- 2020 with $36 billion, up from $33 billion in 2019
- USDCNH with $20.7 billion, up from $16.8 billion
- USDHKD with $15.4 billion, down from $16.4 billion
- All the volume at HKEX
LCH SwapAgent Cross Currency Swaps
The LCH SwapAgent service offers processing (not clearing) for Cross-Currency Swaps and the service registered $2 trillion notional at the end of 2020, up from $0.7 trillion in 2019, an increase of $1.3 trillion. (These figures are not single-sided).
LatAm Swaps
And last but not least, lets look at LatAm Swaps.
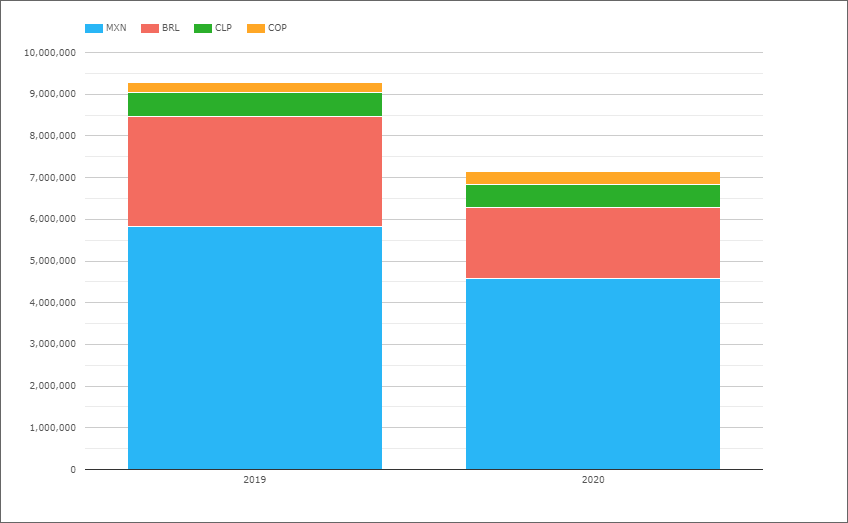
- 2020 with $7.1 trillion, down from $9.3 trillion in 2019 a decrease of 23%
- So comparable in volume to EMEA Swaps
- MXN the largest with $4.6 trillion, down 21% from $5.8 trillion in 2019
- BRL with $1.7 trillion, down 36% from $2.6 trillion in 2019
- CLP with $560 billion, down 2% from $570 billion
- COP with $300 billion, up 33% from $225 billion
Not shown in the chart is that CME has 99% share in each of these currencies with LCH at 1%. (We don’t currently have MXN Swap volumes from Asigna/Mexder).
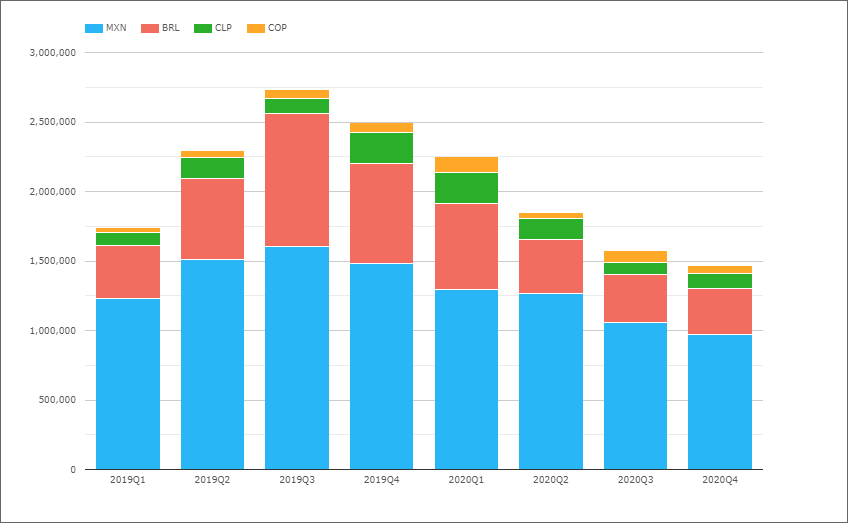
- After the high of 2019Q3, each quarter down on the one before
That’s It
Only 30 Charts for an overview.
There is a lot more data to look at.
We have tenor data for most of the volume.
We have IR Futures in all the major currencies.
US Treasury volumes.
Credit Derivatives and FX Derivatives.
For more details on any of the above.
Please contact us for a CCPView demo or trial.
That’s it for today.
We look forward to an interesting 2021.