Clearing Houses just published their latest CPMI-IOSCO Quantitative Disclosures, which are for the quarter ending 30-Sep-2020, so lets look at what’s new in the data.
- Initial margin for IRS down 3% from the high on 31-Mar-20
- Initial margin for CDS down 7% from the high
- Initial margin for ETD down 13% from the high
- Each as expected given the lower price volatility
- ASX and OCC in the minority of CCPs with higher QoQ IM
- Takasbank (Turkey) has just been added to CCPView
- TCH (Thailand) is also a new addition
- Max IM Call on any day increases at DTCC GSD, HKEX HKCC
- Same day payment to a single participant up at LCH Clearnet Ltd
- CCP Pre-funded own capital increases at OCC & SGX-DC
Background
Under the CPMI-IOSCO Public Quantitative Disclosures, CCPs publish over two hundred quantitative data fields covering margin, default resources, credit risk, collateral, liquidity risk, back-testing and more.
CCPView has 5 years of these quarterly disclosures for thirty-eight Clearing Houses, each with multiple Clearing Services, covering the period from 30 Sep 2015 to 30 Sep 2020. This disclosure data provides insights into trends over time at one CCP and comparisons between CCPs.
Initial Margin for IRS
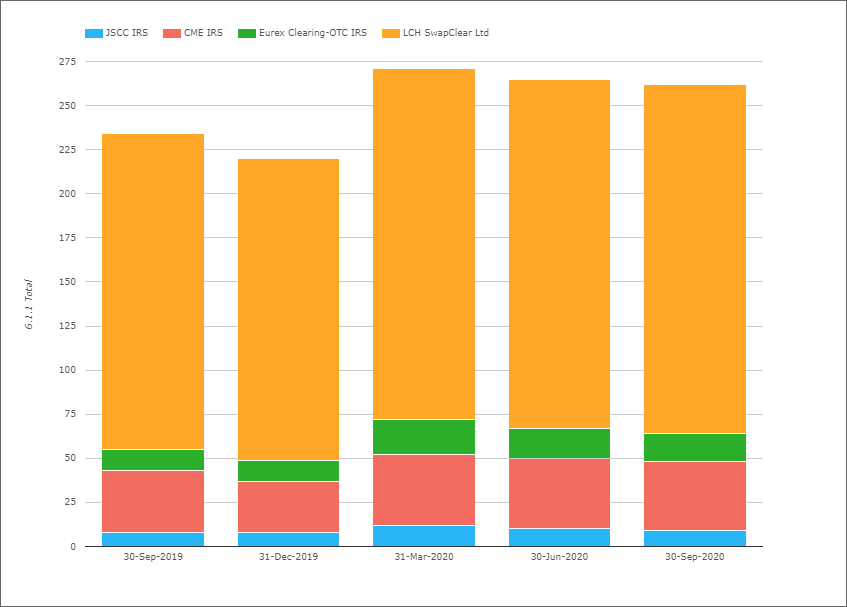
- Total IM for these four CCPs was $263 billion on 30-Sep-2020
- Down 3% from the high of $271 billion on 31-Mar-2020
- Up 12% from $235 billion on 30-Sep-2019
- LCH SwapClear with $198 billion IM, flat QoQ and up 11% YoY
- CME IRS with $39 billion, down 4% QoQ and up 10% YoY
- Eurex OTC IRS with $16.3 billion, down 6% QoQ and up 31% YoY
- JSCC IRS with $9.4 billion, down 8% QoQ and up 13% YoY.
IM drifting down from the record highs we saw on 31-Mar-2020, the Covid-19 crash quarter, but not down by that much given the lower market volatility. Of-course the risk position of members at the CCPs on 31-Sep-2020 is not going to be exactly the same as on 31-Mar-2020; could well be higher, lower or ball-park similar.
Initial Margin for CDS

- Total IM for these three CCPs was $62.1 billion on 30-Sep-2020
- Down 7% from the high of $67 billion on 31-Mar-2020
- Up 33% from $46.6billion on 30-Sep-2019
- ICE Credit Clear with $45.5 billion, down 8% QoQ and up 31% YoY
- ICE Europe Credit with $11.3 billion, down 7% QoQ and up 43% YoY.
- LCH CDSClear with $5.2 billion, up 7% QoQ and up 36% YoY.
CDS IM showing a sharper rise on 31-Mar-2020 than IRS, followed by a small decline and then a larger one in the recent quarter.
Initial Margin for ETD
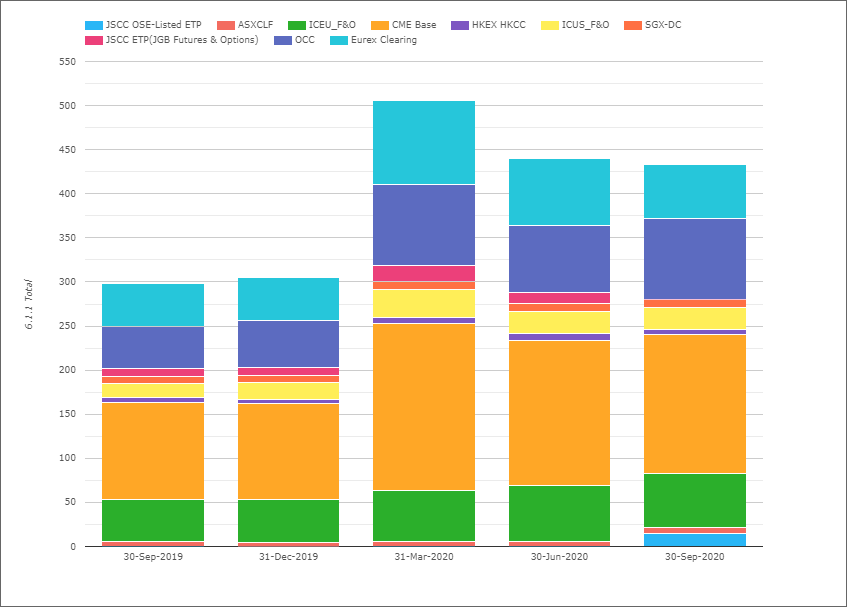
- Total IM for these CCPs was $416 billion on 30-Sep-2020
- Flat QoQ, Down 13% from 31-Mar-20 and Up 49% YoY
- (Note the chart shows slightly higher totals as the Eurex Clearing amount in the chart includes OTC IRS IM, which I exclude in my figures here)
- CME Base with $157 billion, down 5% QoQ and up 43% YOY.
- OCC with $92 billion, up 20% QoQ and up 97% YoY.
- ICE Europe F&O with $61 billion, down 3% QoQ and up 31% YOY.
- Eurex with $44 billion, down 24% QoQ and up 22% YOY.
- ICE US F&O $25 billion, down 4% QoQ and up 53% YOY.
- JSCC OSE Listed ETP with $14.9 billion, which due to re-naming in the QD files is probably not directly comparable to JSCC ETP(JGB Futures & Options) of $12.1 billion on 30-Jun-2020. but all I have done for now
- SGX-DC $9.5 billion, up 2% QoQ and up 13% YoY
- ASX CLF $6.8 billion, up 12% QoQ and 24% YoY
- HKEX HKCC with $6.4 billion, down 7% QoQ and up 8% YoY
OCC standing out as significantly up on 30-Sep-2020 and in-fact higher than the $90.8 billion reached on 31-Mar-20, with both Client and House IM increasing.
Otherwise a similar pattern to IRS and CDS, sharp increase and gradually down.
Takasbank
We recently added Takasbank, the Turkish CCP, so let’s take a look at some of it’s Sep-2020 disclosure data.
- Total IM required at the Takasbank level was $2.1 billion
- This major clearing services within this are BIAS FI with $942 million, Derivatives with $635 million, Securities with $298 million, BIAS Swap with $149 million, BIAS Equity with $64 million and OTC with $16 million
- IM Models are historical and are described with one of three descriptions; SPAN like model generated by historical simulation, Cash flow margin parameters are generated by historical simulation or Risk Aggregation with historical VaR
- IM Confidence level 99.5%, Look Back period of 5 years and Close Out period of 2 days, except for OTC which is 5 days
- BIAS FI has 86 direct clearing members and 36 foreign participants,
- Derivatives has 67 direct clearing members and 25 foreign participants
- There is a lot more from Takasbank…. but I need to move on.
Other Disclosures of Interest
With so many clearing services and disclosures, it is always difficult to know which to cover. The same global ones each time at the expense of the smaller ones, or try and home in on the noteworthy movements or even a random selection? Last time I looked just at a few disclosures from CCPs starting with C, so not random but an idiosyncratic selection nonetheless.
This time, lets do a quick scan of Sep-2020 disclosures highlighting those with a change tolerance >20% outside the 3 year range of values:
- ASXCLF – 6.2.3 Client IM Secured cash deposited at commercial banks (including reverse repo) was A$5.8 billion, the prior quarter was A$3.8 billion
- B3 – 4.4.3 Peak Day amount in previous 12 months where the estimated largest aggregate stress loss (in excess of initial margin) that would be caused by default of a single participant… was $402 million, up from $329 million
- CME IRS – 6.2.1 Total IM cash deposited at central bank of issue of the currency was $12.6 billion, up from $10.7 billion
- DTCC GSD – 6.8.1 maximum aggregate IM call on any given day over the period was $3.98 billion, up from $3.3 billion
- HKEX HKCC – 6.8.1 maximum aggregate IM call on any given day over the period was $3 billion, up from $715 million
- LCH Clearnet Ltd – 7.3.4 Same day payment total EUR, actual largest intraday and multiday payment obligation of a single participant over the past 12 months was EUR 6.157 billion, up from EUR 5.16 billion
- OCC – 4.1.1 Prefunded – Own capital before increased to $215 million from $147 million., while 6.1.1 House IM required of $25.7 billion is a new high, up from the prior high of $21.6 billion on 31-Mar-20
- SGX-DC – 4.1.1 Prefunded – Own capital before increased to S$274 million from S$90 million
There is a lot more to look for, but I will leave that to those of you with CCPView access.
More Disclosures
CCPView has disclosures from thirty eight Clearing Houses, each with many Clearing Services, so there is a lot more data to look at covering Equities, Bond, Futures, Options and OTC Derivatives.
With over 200 quantitative data fields and quarterly figures from September 2015 to September 2020, there is a lot of data to analyse.