2022 volumes and market share for OTC Derivatives in Interest Rates reported by Clearing Houses.
Clarus CCPView has daily volume and open interest data published by each CCP, which is filtered, normalised and aggregated to allow meaningful analysis and comparisons.
Contents:
- USD Swaps (LIBOR, OIS, SOFR)
- EUR Swaps (EURIBOR, OIS, €STR)
- GBP Swaps (LIBOR, SONIA)
- JPY Swaps (IBOR, TONA)
- AUD Swaps (BBSW, AONIA)
- CAD Swaps (IBOR, CORRA)
- EMEA Swaps
- AsiaPac Swaps
- LatAm Swaps
Onto the charts, data and details.
Volumes and Market Share
For major currencies and regions, vanilla swaps referencing IBORs and OIS Swaps referencing RFRs.
We use single-side gross notional and cleared volume over a period, either a Year, a Quarter or a Month.
USD Swaps (Libor)
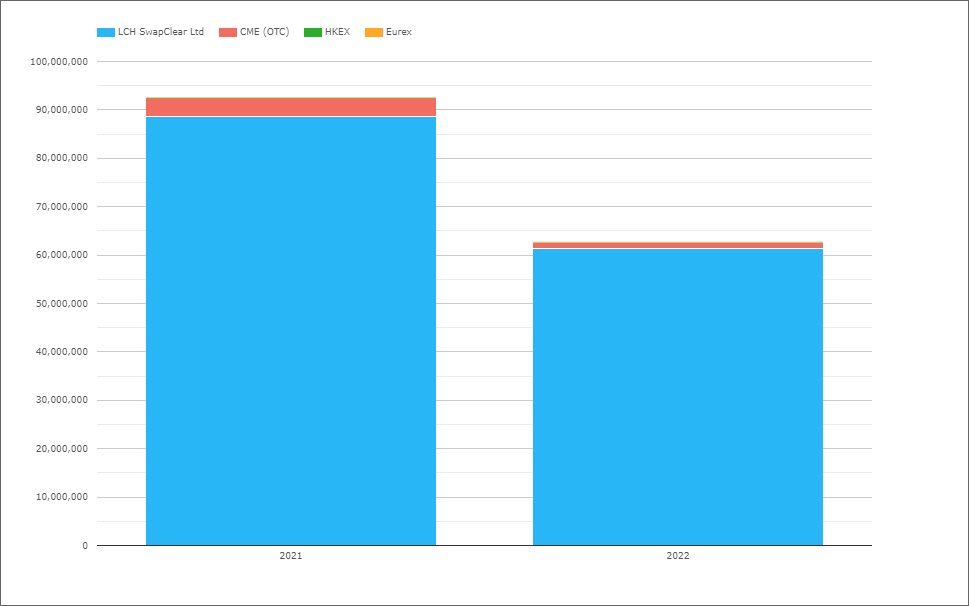
- 2022 with $62.7 trillion compared to $92.5 trillion in 2021 (and $63 trillion in 2020)
- A $30 trillion decrease, equivalent to 32%
- 2022 volume still higher than we would expect given the SOFR first initiatives and restrictions on new Libor risk, but one explained by the inclusion of single-period swaps in the figures to manage portfolio rate reset risk (instead of FRAs) and other portfolio maintenance activity
- LCH SwapClear with $61.4 trillion in 2022 and $88.6 trillion in 2021
- CME OTC with $1.3 trillion in 2022 and $3.9 trillion in 2021
- 2022 Share is LCH 97.9% and CME 2.1%, compared to 95.8% v 4.2% in 2021, but not really an apples to apples comparison given the FRA issue noted above.
A chart showing Libor Swaps by month for 2022 is illustrative, with monthly volumes falling sharply over the course of the year, from >$10 trillion in Jan 2022 to $2 trillion, as we near the end of USD Libor in June 2023.
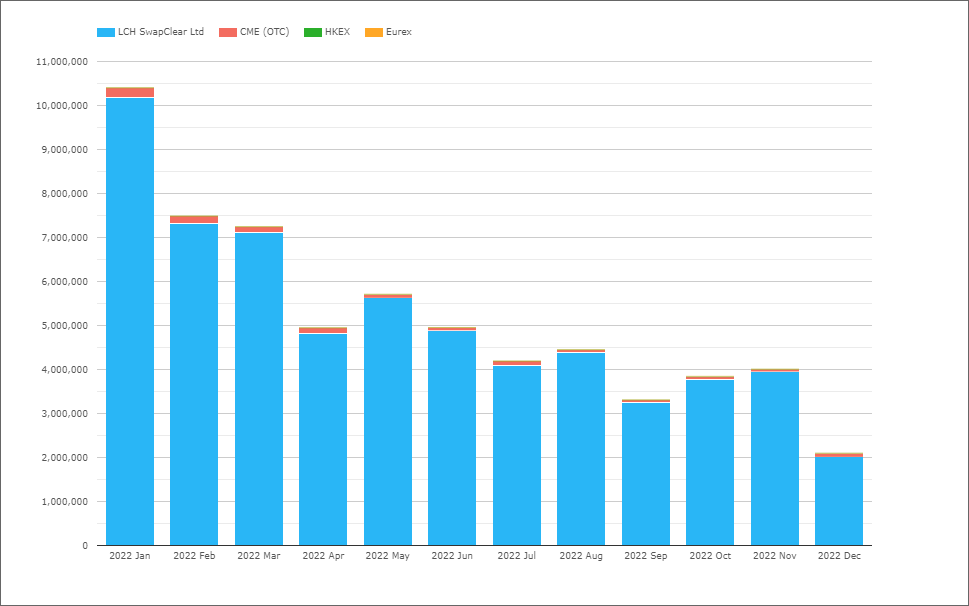
As we noted in the 2021 review, some of the IRS volume is due to single-period-swaps, which in prior years would have been transacted as FRAs.
USD OIS (All)
Referencing Fed Funds and SOFR.
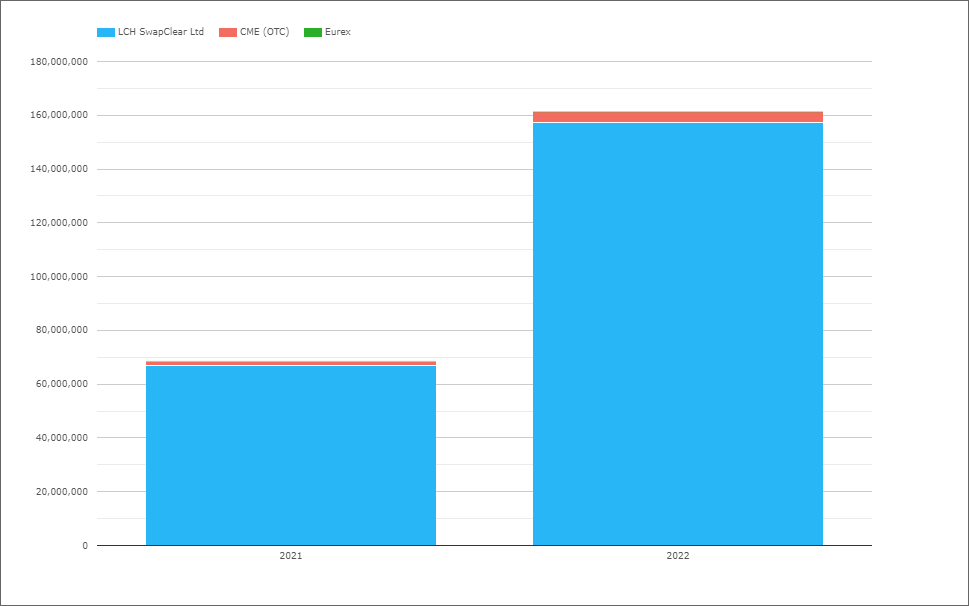
- 2022 with $161.4 trillion compared to $68.5 trillion in 2021, an increase of 235%
- LCH SwapClear with $157.4 trillion in 2022 and $66.9 trillion in 2021
- CME OTC with $4 trillion in 2022 and $1.7 trillion in 2021
- 2022 Share is LCH 97.5% and CME 2.5%, same as in 2021
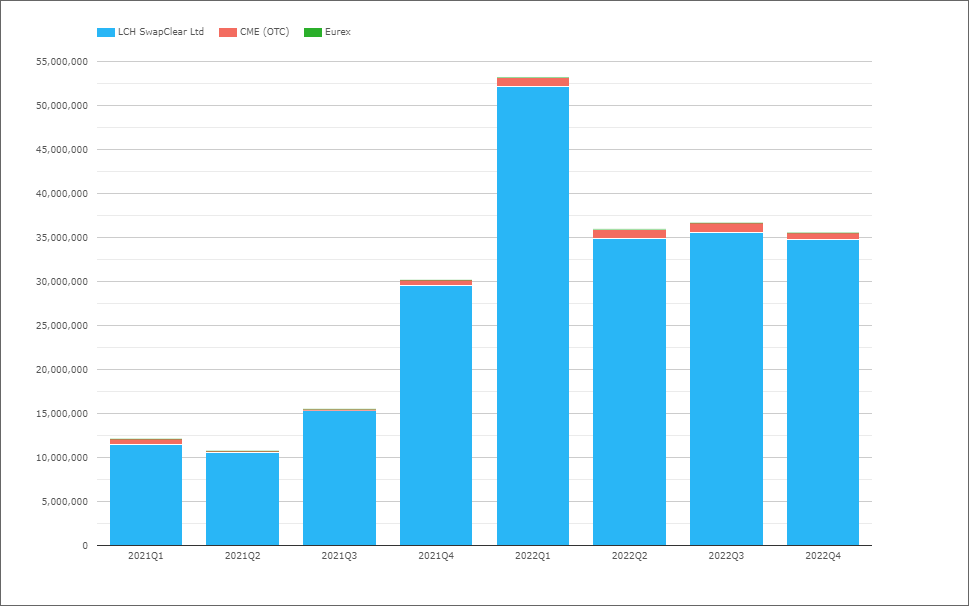
- 2022Q1 with $53 trillion a record high quarter
- The remaining quarters @ $35 trillion
- Federal Reserve rate rise expectations driving volumes
USD Swaps (SOFR)
Next isolating Swaps that reference SOFR, either OIS or Basis.
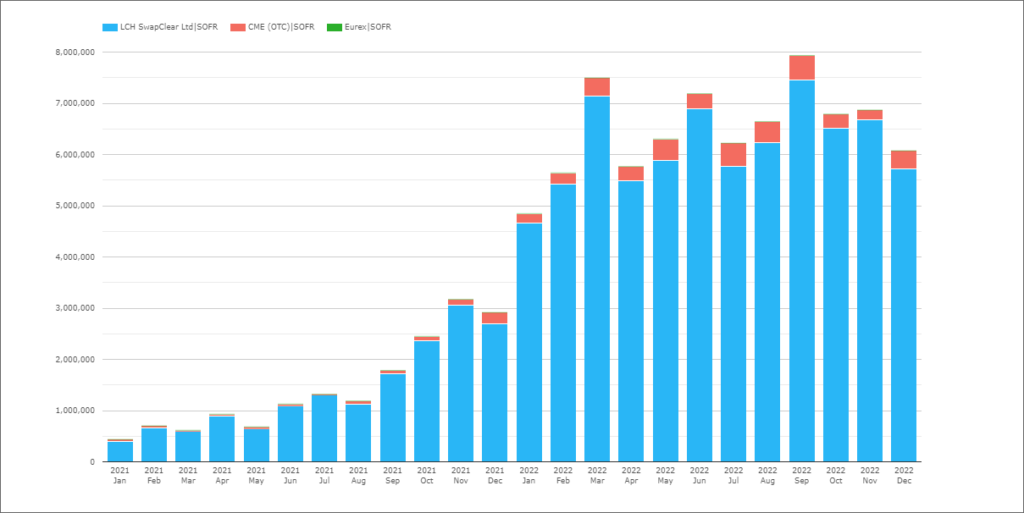
- 2021 with $17.3 trillion, so 25% of the $68.5 trillion of OIS Swaps
- 2022 with $77.8 trillion, so 48% of the $161.4 trillion of OIS Swaps
- An increase of $60.5 trillion or 350% YoY and now more than Libor Swaps
- Monthly peaks in March, June, September of > $7.5 trillion each
- LCH SwapClear with $73.8 trillion in 2022, a 95% market share
- CME OTC with $3.9 trillion in 2022, a 5% market share
That’s all for USD for today.
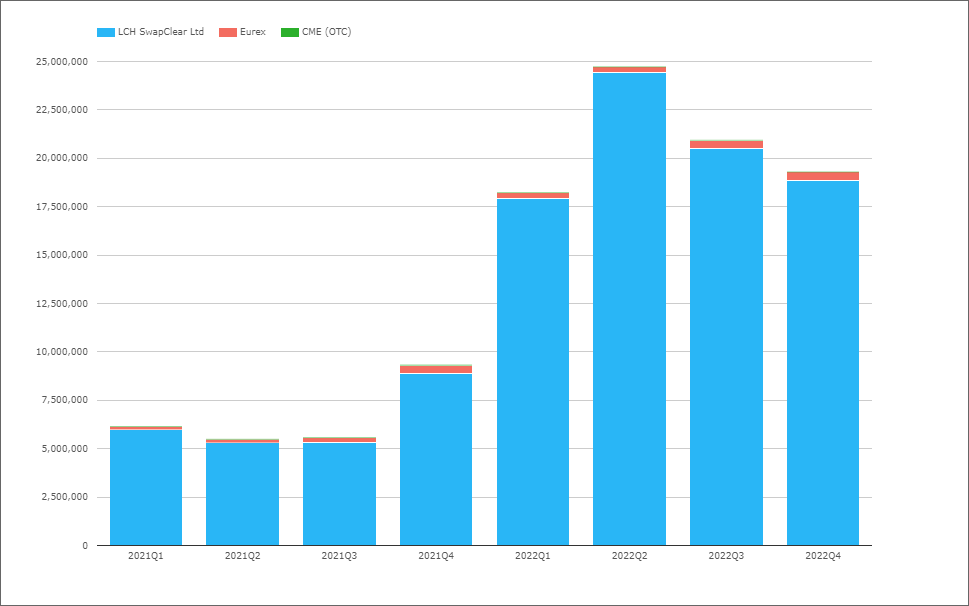
EUR Swaps (Euribor)
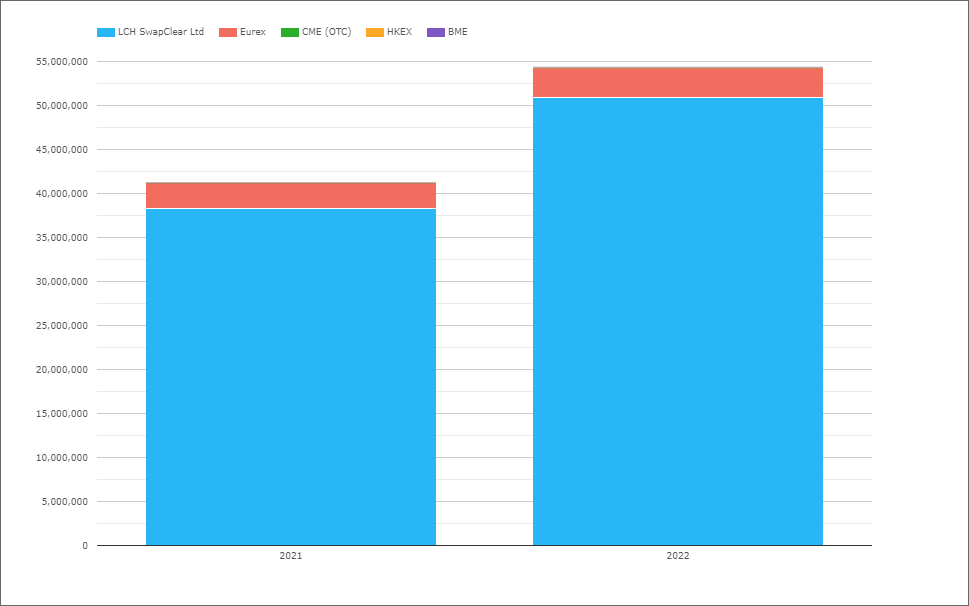
- 2022 with €54.3 trillion compared to €41.2 trillion in 2021, an increase of 32%
- LCH SwapClear with €50.9 trillion in 2022 and €38.2 trillion in 2021
- Eurex with €3.35 trillion in 2022 and €2.97 trillion in 2021
- 2022 market share is LCH 93.8%, Eurex 6.2% and CME <0.1%
- While 2021 share was 92.8%, 7.2% and <0.1% respectively
- 2020 share was 94%, 5.8% and 0.2%
- 2019 share was 96.2%, 3.5% and 0.2%
So the Eurex gain of 1-2% share each year from 2019-2021, has not continued in 2022
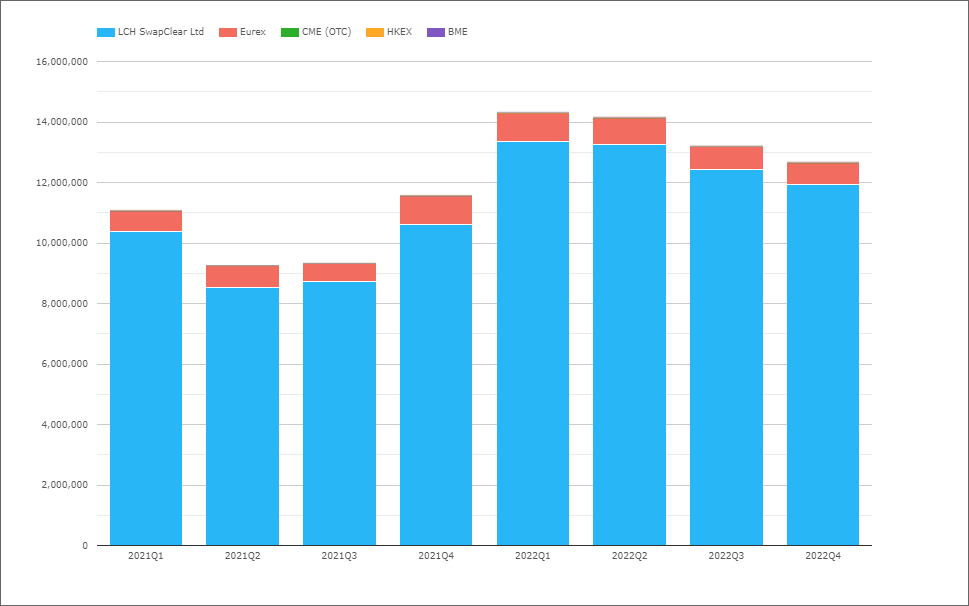
- 2022Q1 the highest with €14.3 trillion
- Remianing quarters drifting down to €12.6 trillion in 2022Q4
- Eurex sharing ranging from 6.7% in 2022Q1 to 5.7% in 2022Q4
The EU CCP equivalence for UK CCPs was extended in Feb 2022 from expiry in June 2022 to June 2025 and this may have had an impact, resulting in a drop in Eurex share. Definitely one to keep an eye on in the quarters ahead.
EUR OIS (All)
Referencing either EONIA or €STR.
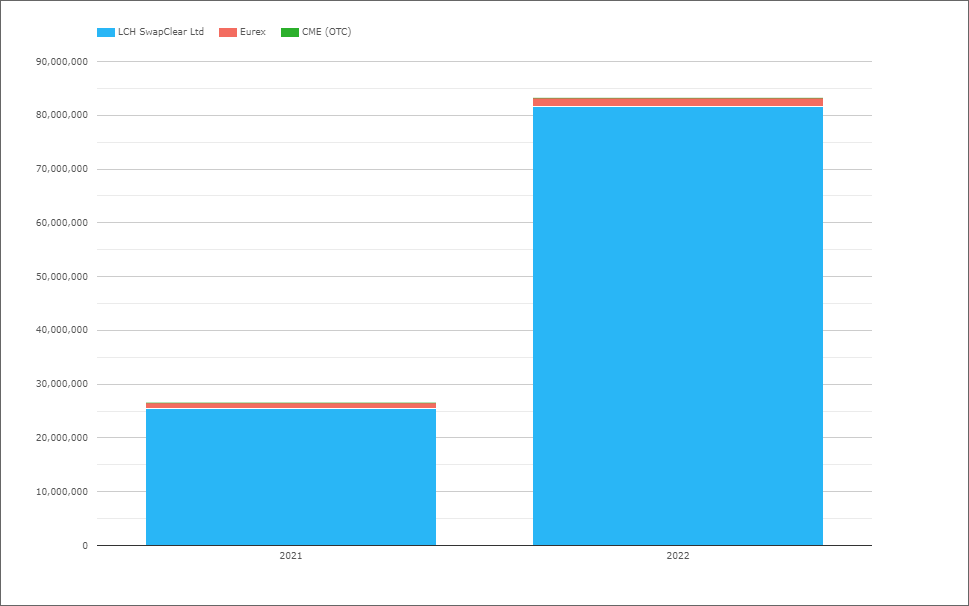
- 2022 with €83.3 trillion, up from €26.6 trillion in 2021 and €36.3 trillion in 2020
- An increase of €56.7 trillion or 210%
- LCH SwapClear with €81.7 trillion in 2022 and €25.5 trillion in 2021
- Eurex with €1.5 trillion in 2022 and €1.06 trillion in 2021
- 2022 market share is LCH 98.2% and Eurex 1.8%
- 2021 market share was LCH 95.8% and Eurex 4%
- 2020 share was LCH 98.3% and Eurex 1.7%
- 2022Q2 with €24.7 trillion is the record highest quarter
- While 2022Q1 with €18.2 trillion was the prior high
EUR Swaps (€STR)
Next isolating Swaps that reference €STR, either OIS or Basis.
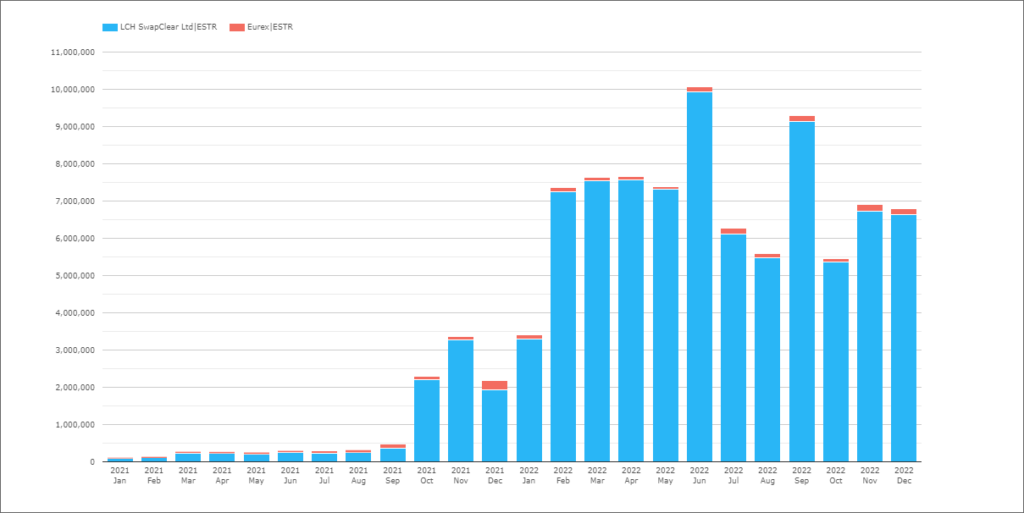
- The first pick up in 2021Oct as the €STR reference replaced EONIA for Swaps
- A big pick-up in 2022Feb and a peak in 2022Jun of €10 trillion
GBP Swaps (Libor)
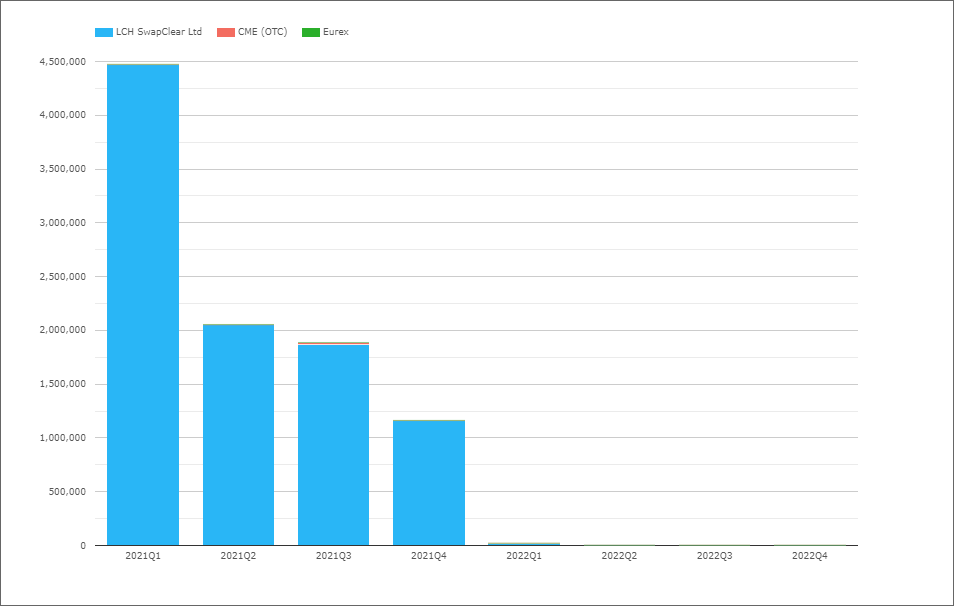
- A clear trend of vanishing volumes as GBP Libor ended on 31Dec2021
- 2021Q1 with £4.5 trillion
- 2021Q4 with £1.2 trillion
- 2022Q4 with £3 billion
- Strange writing that, given how used to GBP Libor we have been for 30+ years now
- Not sure why there are a couple of days a month with some volume at LCH, persumably some residual portfolio maintainence activity
Let’s move onto the replacement rate, SONIA.
GBP OIS (SONIA)
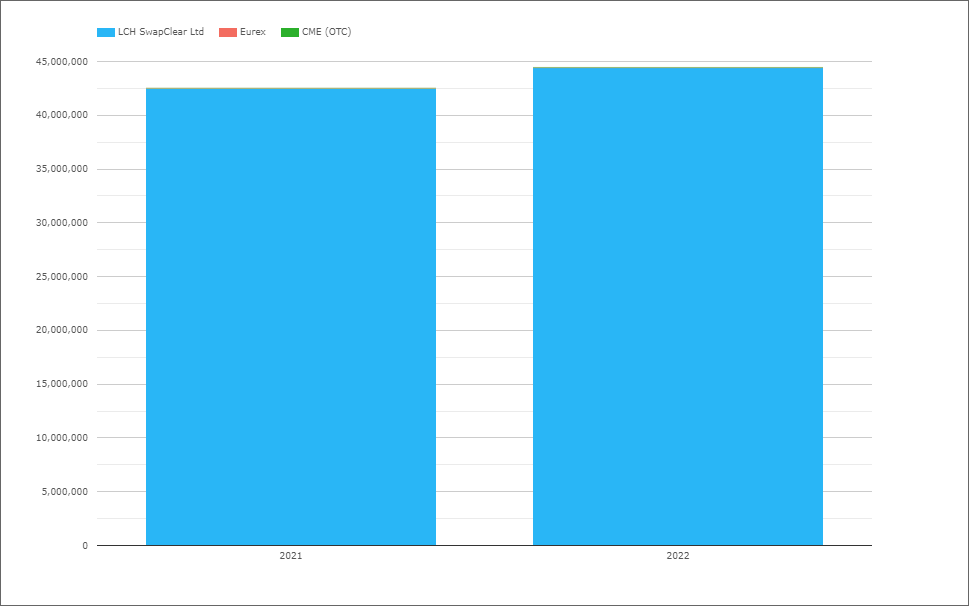
- 2022 with £44.5 trillion compared to £42.5 trillion in 2021, an increase of 5%
- LCH SwapClear with close to 100% market share
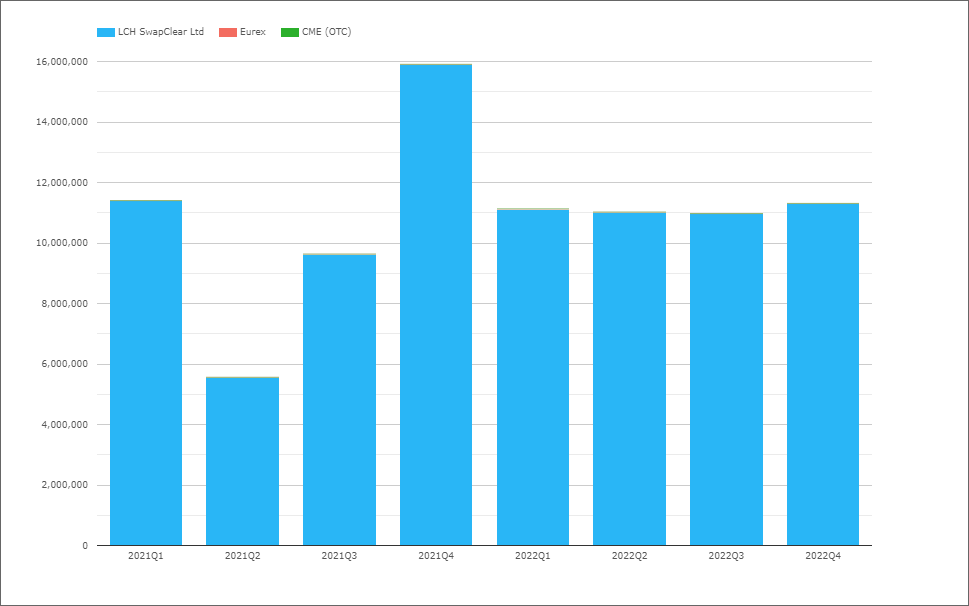
- A peak of £16 trillion in 2021Q4
- 2022 with a consistent £11 trillion each quarter
JPY Swaps (IBOR)
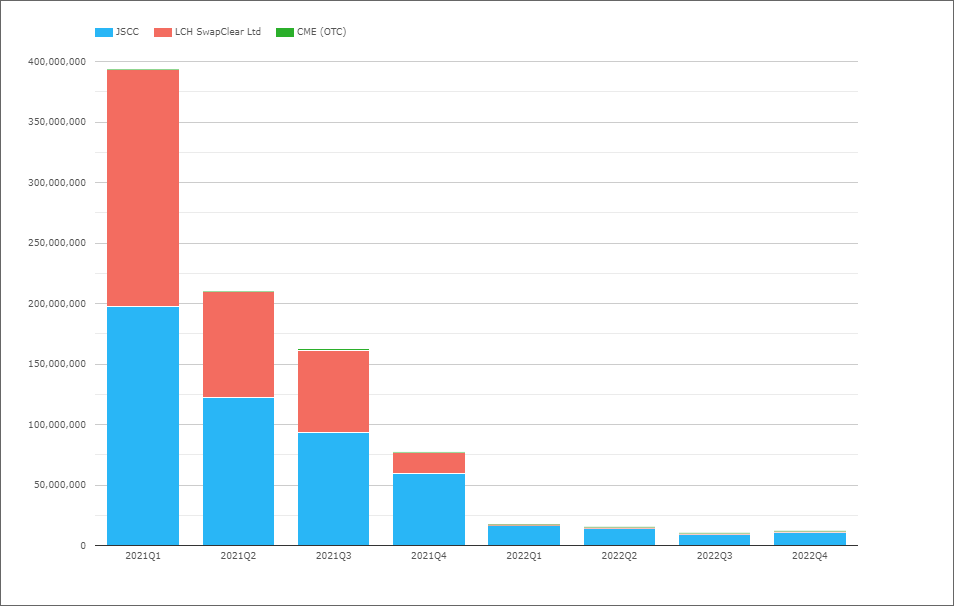
- A clear trend of vanishing volumes as JPY Libor ends
- 2021Q1 with Y394 trillion
- 2021Q4 with Y17.4 trillion
- 2022Q4 with Y11.5 trillion, of which Y11 trillion is at JSCC and all in Tibor
JPY OIS (TONA)
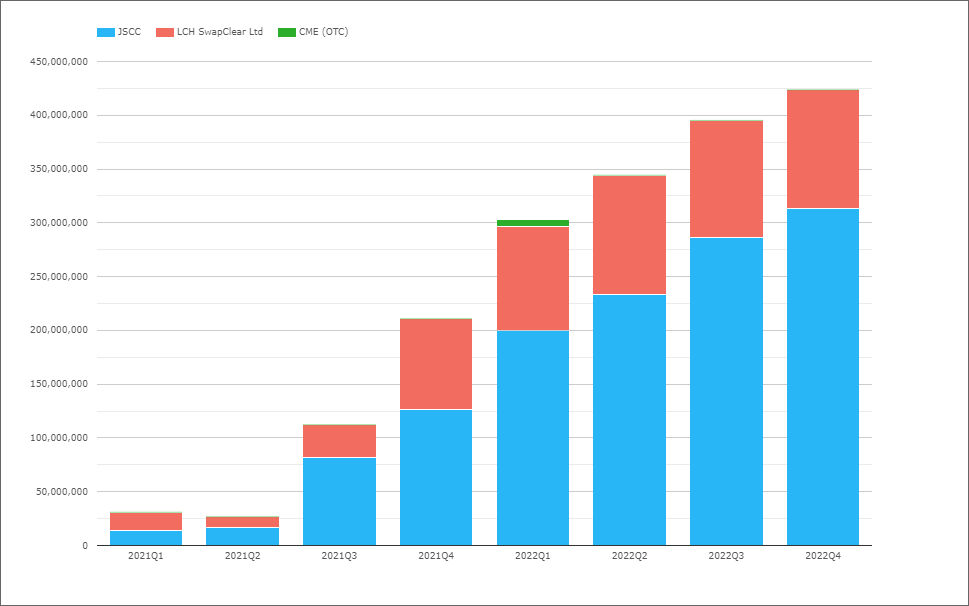
- A clear trend of increasing volumes as JPY TONA takes over
- 2021Q1 with Y30.9 trillion
- 2021Q4 with Y211 trillion
- 2022Q1 with Y424 trillion
- 2002 share was JSCC 70.4%, LCH 29.2%, CME 0.5%
- While 2021 share was JSCC 63%, LCH 36.9%, CME 0,1%
- JSCC gaining share over LCH
AUD Swaps
As Australia is a multi-rate jurisdiction with both AONIA and BBSW, we will chart IRS, OIS and Basis products.
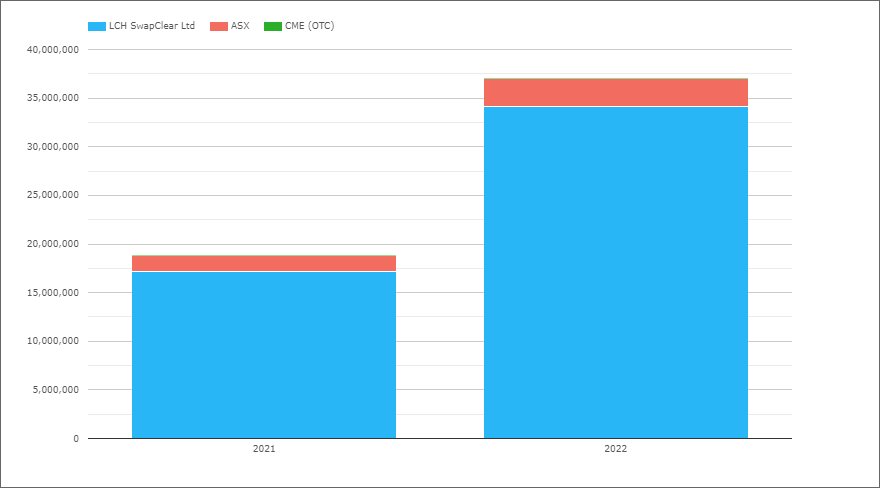
- 2022 with A$37 trillion compared to A$18.8 trillion in 2021, an increase of 97%
- A huge increase in LCH OIS volumes from A$4.9 trillion to A$19.5 trillion (not shown)
- LCH with A$34.1 trillion in 2022, an 92.1% market share
- ASX with A$2.9 trillion in 2022, an 7.9% market share
- The 2021 share was LCH 90.4% to ASX 9.4%
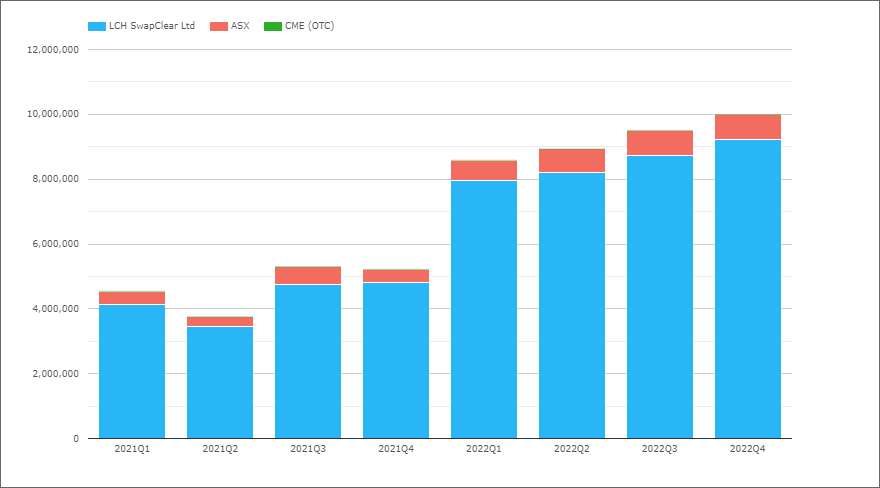
Volumes higher in each quarter of 2022, starting at A$8.6 trillion and up to A$10 trillion as the RBA increased rates by 3% over the course of the year.
CAD Swaps
Charting both IRS and OIS.
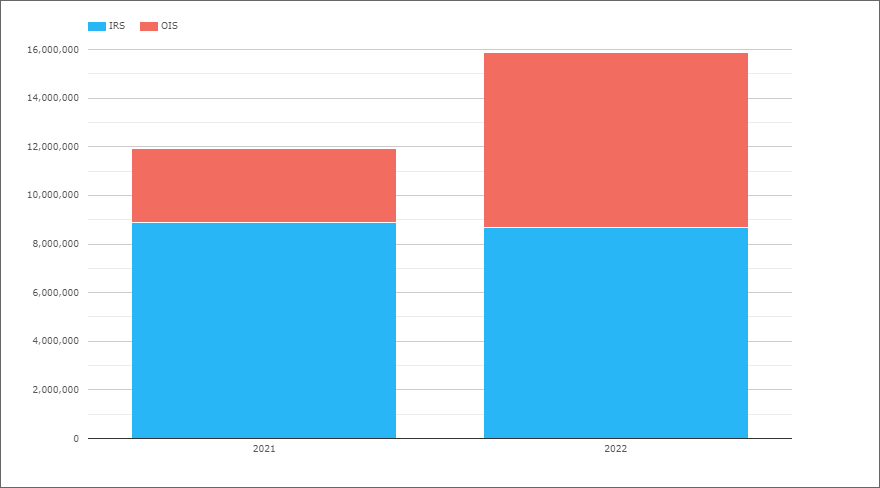
- 2022 with C$15.9 trillion compared to C$11.9 trillion in 2021, an increase of 34%
- OIS (CORRA) increasing to C$7.2 trillion from C$3 trillion
- IRS similar at C$8.65 trillion and C$8.87 trillion
- LCH SwapClear with close to 100% of the volume
Quarterly volumes do not show any trend of interest, so will skip those.
EMEA Swaps
Now let’s switch to EMEA Swaps (all types) and volumes by currency.
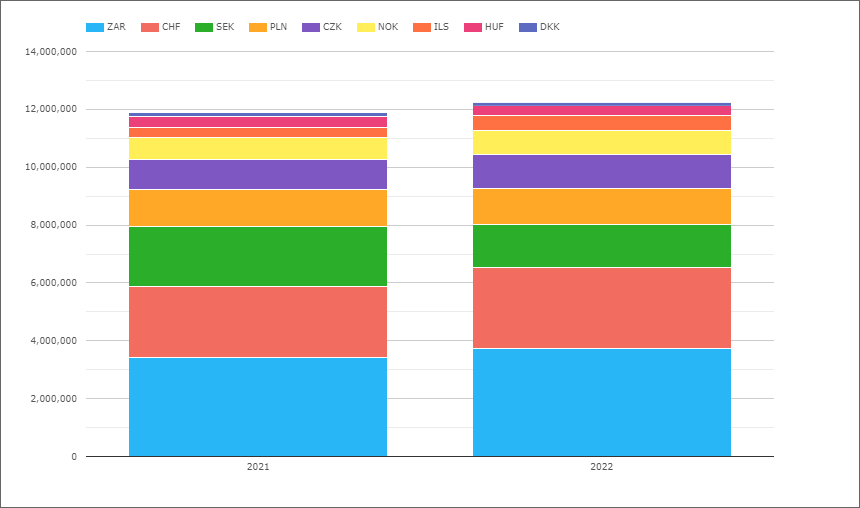
- 2022 with $12.25 trillion, slightly up from $11.9 trillion in 2021
- ZAR the largest currency with $3.7 trillion in 2022, up from $3.4 trillion
- CHF with $2.8 trillion, up from $2.5 trillion
- SEK with $1.5 trillion, down from $2 trillion
- PLN with $1.26 trillion, similar to $1.28 trillion
- CZK with $1.17 trillion, up from $1.04 trillion
- NOK with $825 billion, up from $764 billion
- ILS with $517 billion, up from $337 billion
- HUF with $332 billion, down from $387 billion
- DKK with $126 billion, down from $147 billion
Not shown in the chart is that LCH SwapClear has 98.2% of the overall EMEA 2022 volume.
The only currencies where LCH has less than 99% share are:
- PLN, with LCH 94.8%, KDPW 2.0% and CME 2.2%
- SEK, with LCH 96.1%, Nasdaq OMX 3.9%
- HUF, with LCH 97.7%, CME 2.3%
- CZK, with LCH 98.6%, CME 1.4%
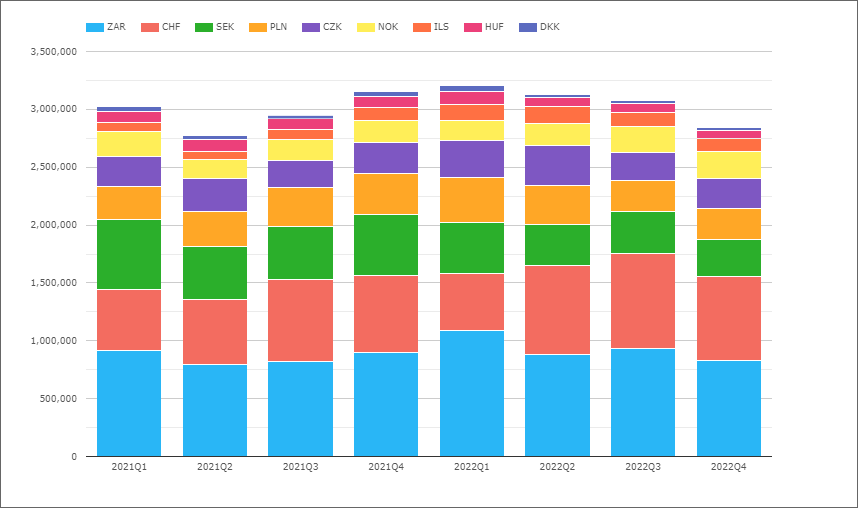
- Each quarter in 2022 with @ $3 trillion of volume
AsiaPac Swaps
Now let’s switch to AsiaPac Swaps (all types) and volumes by currency.
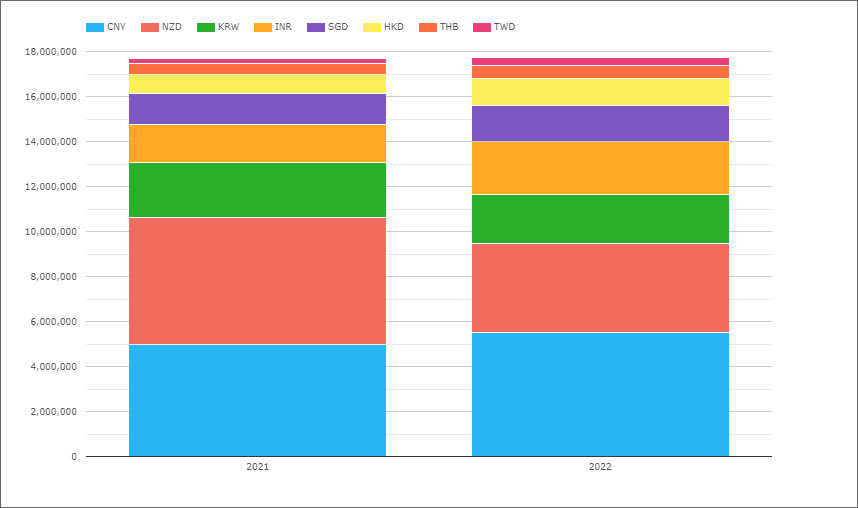
- 2022 with $17.7 trillion, the same as in 2021
- CNY with $5.5 trillion, up from $5 trillion
- NZD with $3.9 trillion, down from $5.6 trillion
- INR with $2.3 trillion, up from from $1.7 trillion
- KRW with $2.2 trillion, down from $2.45 trillion
- SGD with $1.6 trillion, up from $1.35 trillion
- HKD with $1.2 trillion, up from $837 billion
- THB with $574 billion, up from $522 billion
- TWD with $342 billion, up from $230 billion
Not shown in the chart is that LCH SwapClear has 78% of the overall AsiaPac 2022 volume.
The only currencies where LCH has less than 100% share are:
- CNY, with Shanghai Clearing 55.4%, LCH 44.4%, HKEX 0.3%
- INR, with LCH 62.7%, CCIL 37.3%
- HKD, with LCH 97.7%, HKEX 1.9%, CME 0.5%
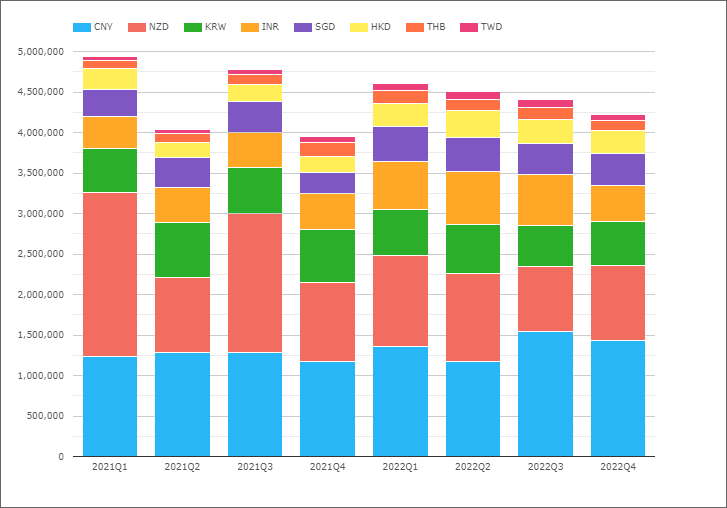
- Each 2022 quarter, in the $4.2 trillion to $4.5 trillion range
- So materially larger than the $3 trillion for EMEA
LatAm Swaps
And last but not least, lets look at LatAm Swaps.
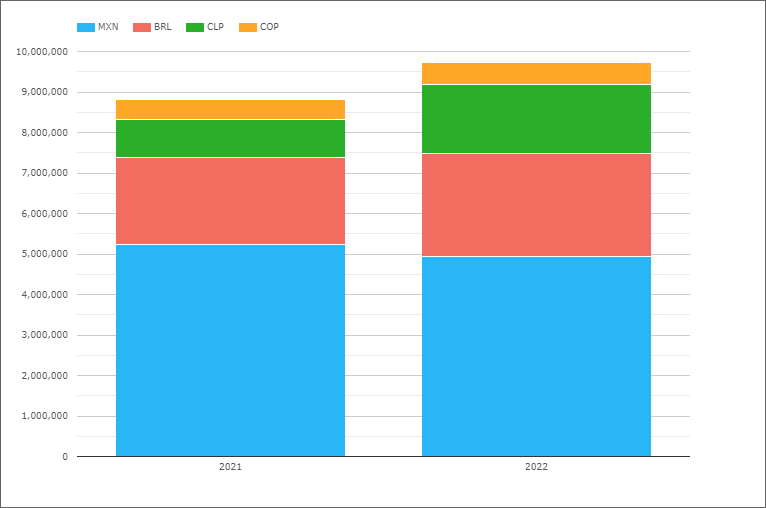
- 2022 with $9.7 trillion, up from $8.8 trillion in 2021 (and $7.1 trillion in 2020)
- MXN the largest with $4.9 trillion, down from $5.2 trillion
- BRL with $2.55 trillion, up from $2.16 trillion
- CLP with $1.7 trillion, up from $940 billion is the largest gainer
- COP with $550 billion, up from $495 billion
Not shown in the chart is that CME has >98% share in each of these currencies except MXN, where CME had 90.2% in 2022, Asigna/Mexder with 8.2% and LCH with 1.6%.
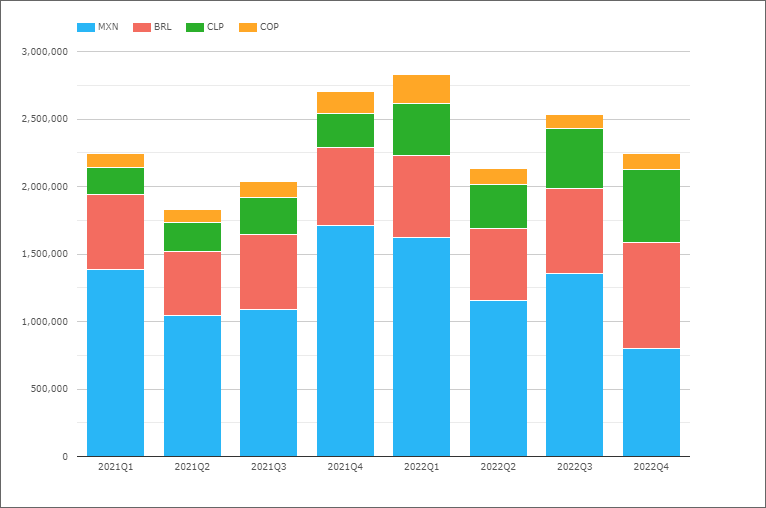
- 2022Q1 the highest with $2.8 trillion
- Remaining 2022 quarters in the $2.1 trillion to $2.5 trillion range
That’s It
Only 22 Charts for an overview.
There is a lot more data to look at.
Maturity tenor data.
IR Futures in all the major currencies.
US Treasury volumes.
Credit Derivatives and FX Derivatives.
For more details on any of the above.
Please contact us for a CCPView demonstration.
That’s it for today.
We look forward to an interesting 2023.