2023 volumes and market share for OTC Derivatives in Interest Rates reported by Clearing Houses.
Clarus CCPView has daily volume and open interest data published by each CCP, which is filtered, normalised and aggregated to allow meaningful analysis and comparisons.
Contents:
- USD Swaps (LIBOR, FF, SOFR)
- EUR Swaps (EURIBOR, €STR)
- GBP Swaps (LIBOR, SONIA)
- JPY Swaps (IBOR, TONA)
- AUD Swaps (BBSW, AONIA)
- CAD Swaps (CDOR, CORRA)
- EMEA Swaps
- AsiaPac Swaps
- LatAm Swaps
Onto the charts, data and details.
Volumes and Market Share
For major currencies and regions, vanilla swaps referencing IBORs and OIS Swaps referencing RFRs.
We use single-side gross notional and cleared volume over a period, either a Year, a Quarter or a Month.
All charts are created in CCPView and exported.
USD Swaps (Libor, FF, SOFR)
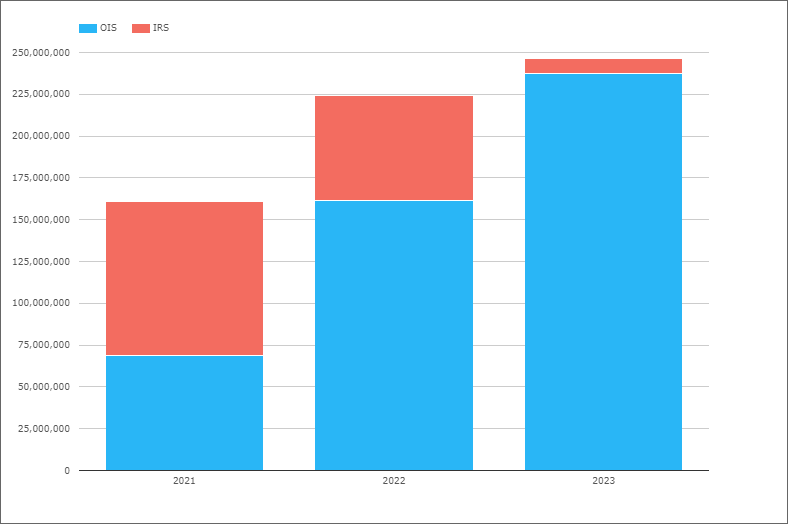
- IRS (Libor) volume down to $9.3 trillion, from $62.7 trillion and $92.5 trillion in prior years
- Showing clearly the end of Libor, with only $51b in Dec 2023
- OIS (FF and SOFR) volume up to $237 trillion from $161 trillion and $69 trillion in prior years
- An increase of $76 trillion or 47% in 2023
- Due both to the take-up of SOFR from Libor and increase in FF (as Fed rates change)
- 2023 OIS volume of $237 trillion is $125 trillion SOFR and $112 trillion FF.
Switching to Open Interest (Outstanding notional).
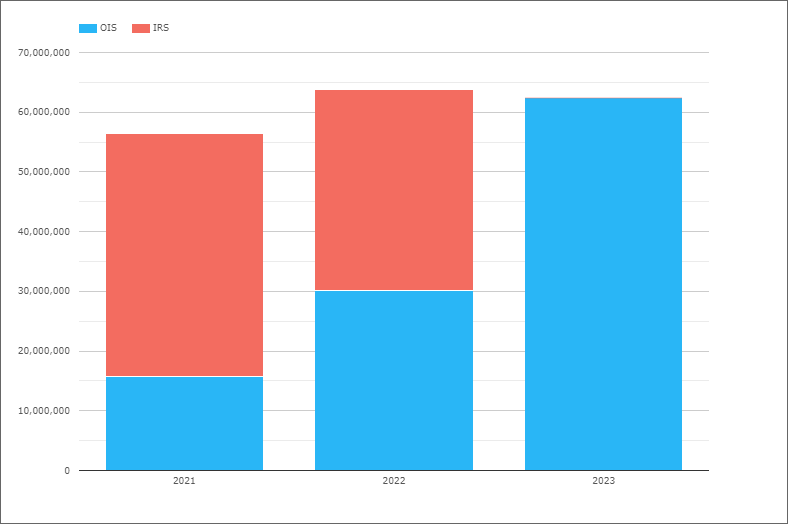
- OIS (FF, SOFR) OI is $62 trillion on 29Dec2023, from $30 trillion and $16 trillion at prior year ends
- The $62 trillion on 29Dec2023 is made up of SOFR $58 trillion and FF $4 trillion
- IRS (Libor) OI has gone to nothing from $34 trillion and $41 trillion at prior year ends
- Showing even more clearly the end of Libor Swaps trading
USD OIS (FF, SOFR)
Turning next to OIS volume market share.
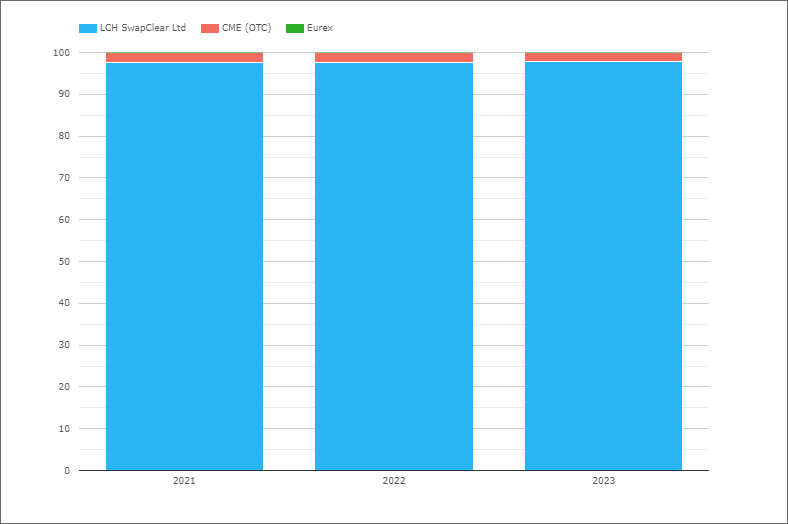
- LCH SwapClear with 97.7% in 2023, similar to the 97.5% in each of the prior two years
- CME OTC with 2.3% in 2023, similar to the 2.5% in prior years
- If we select only Client volume at LCH, the CME share increases to 2.9% in 2023, compared to 3.5% and 3.4% in prior years
That’s it for USD, a banner year for OIS volumes, SOFR replacing Libor, FF also up and market share remaining the same with LCH SwapClar dominant and CME a touch lower.
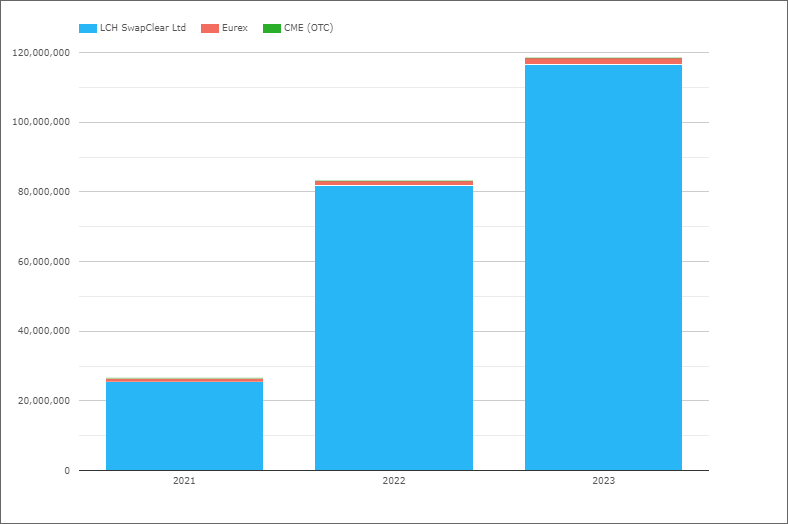
EUR Swaps (Euribor)
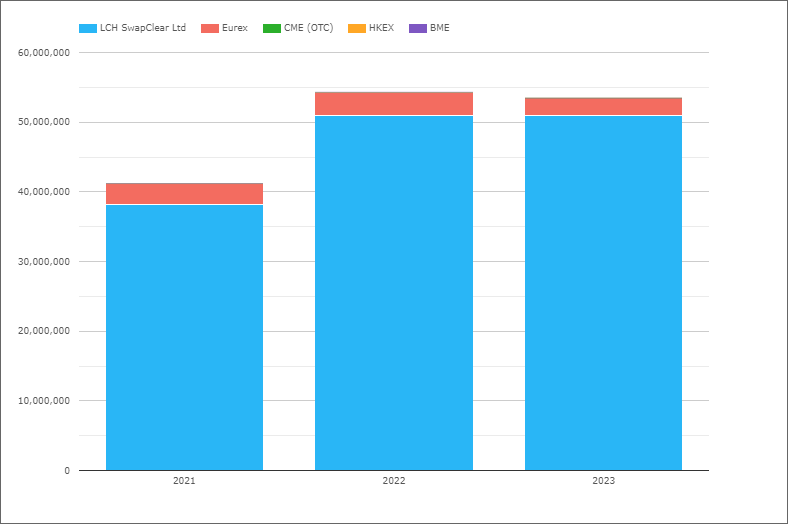
- 2023 with €53.5 trillion, down from €54.3 trillion in 2022 and up from €41.2 trillion in 2021
- LCH SwapClear with €51 trillion in 2023 and €50.9 trillion in 2022
- Eurex with €2.47 trillion in 2023 and €3.35 trillion in 2022
- 2023 market share is LCH 95.4%, Eurex 4.6%
- While 2022 share was LCH 93.8%, Eurex 6.2%
- 2021 share was 92.8%, 7.2%, while 2020 share was 94%, 5.8% respectively
So the gain in share at Eurex in 2020 and 2021 has reversed in 2022 and 2023.
EUR OIS (All)
Referencing either EONIA or €STR.
- 2023 with €118.5 trillion, up from €83.3 trillion in 2022 and from €26.6 trillion in 2021
- An increase of €35.2 trillion or 42% in 2023
- LCH SwapClear with €116.6 trillion in 2023 and €81.7 trillion in 2022
- Eurex with €1.9 trillion in 2023 and €1.5 trillion in 2022
- 2023 market share is LCH 98.4% and Eurex 1.6%
- 2022 share was LCH 98.2% and Eurex 1.8%
- 2021 share was LCH 95.8% and Eurex 4%
- 2020 share was LCH 98.3% and Eurex 1.7%
So except for the jump in Eurex share in 2021, LCH share has been steady at just over 98%
GBP Swaps (Libor, SONIA)
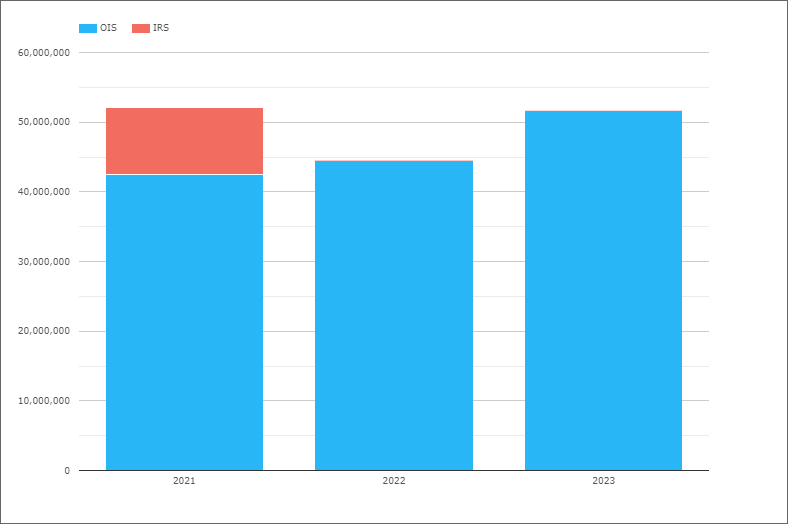
- IRS (Libor) down from £9.5 trillion in 2021 to zero.
- OIS (SONIA) volume is £51.6 trillion in 2023, up from £44.5 trillion in 2022
- And increase in 2023 of £7.1 trillion or 16%
- 2022 with £44.5 trillion compared to £42.5 trillion in 2021, an increase of 5%
- LCH SwapClear with 99.9% market share
Open Interest (Outstanding notional) in SONIA Swaps on 29Dec2023 at £12.6 trillion is actually down from £13.15 trillion and £13.5 trillion at prior year ends, despite the higher volumes in 2023.
JPY Swaps (IBOR, TONA)
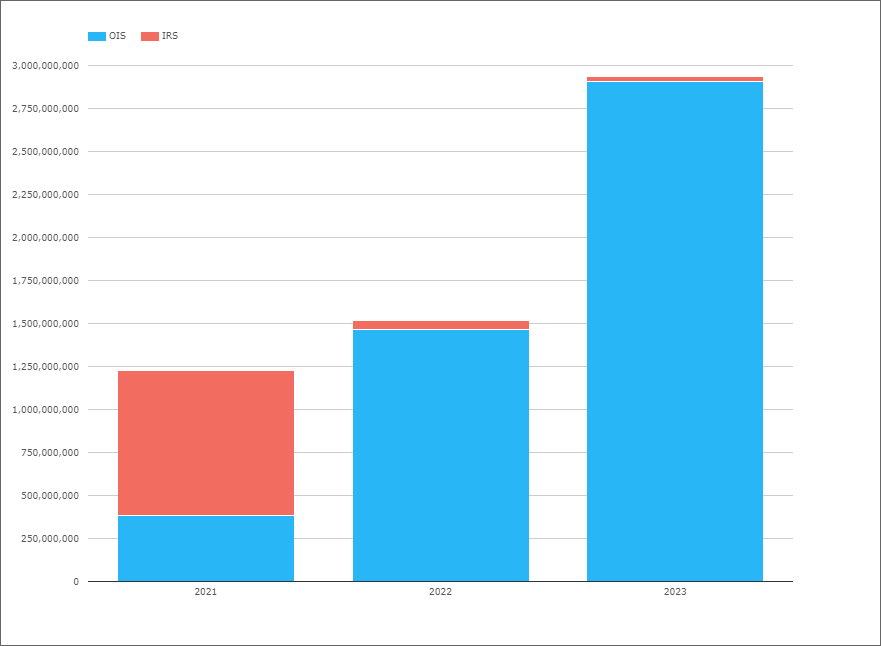
- IRS (IBOR) dropping from Y843 trillion in 2021 to Y28 trillion in 2023
- OIS (TONA) up to Y2,905 trillion from Y1,467 trillion the year before
- An increase of close to 100%
JPY OIS (TONA)
Turning next to OIS volume market share.
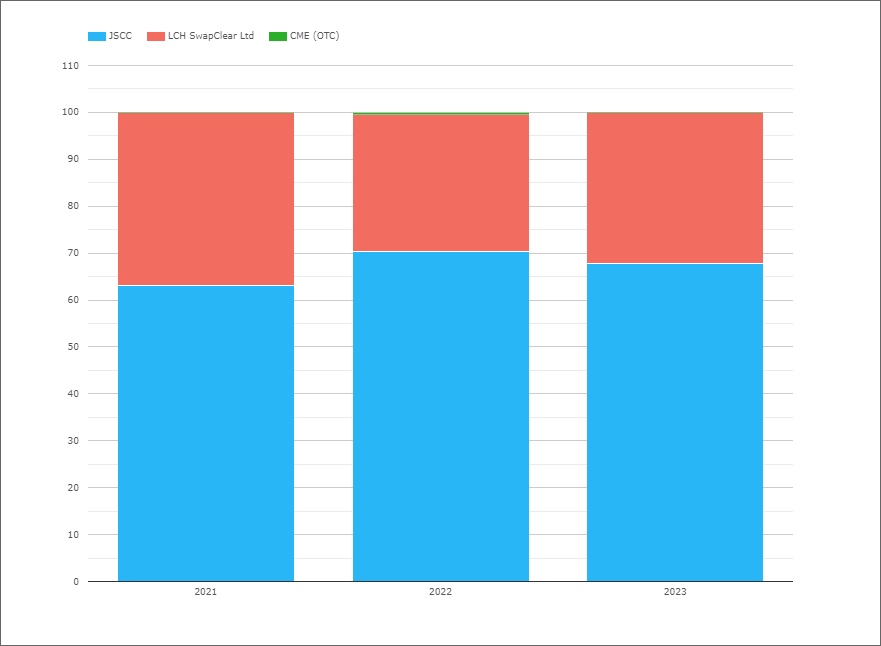
- 2023 share is JSCC 67.8% and LCH 32.2%
- 2022 share was JSCC 70.4%, LCH 29.2%, CME 0.5%
- 2021 share was JSCC 63%, LCH 36.9%, CME 0.1%
AUD Swaps (BBSW, AONIA)
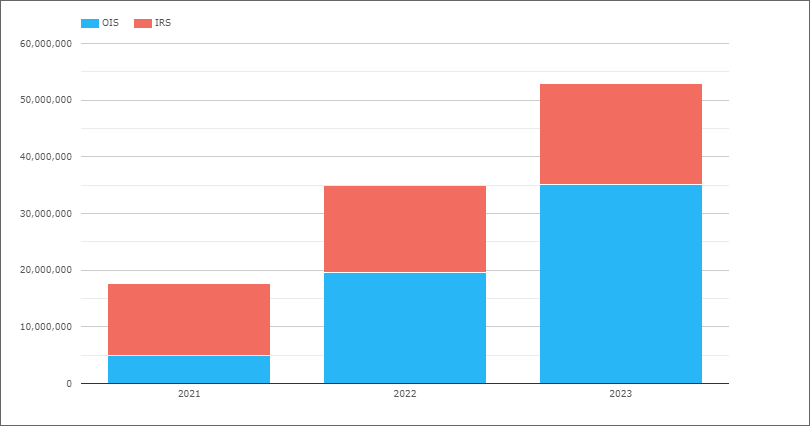
- OIS (AONIA) up to A$35.2 trillion from A$19.5 trillion a year earlier, an increase of >80%
- IRS (BBSW) up to C$17.8 trillion in 2023 from C$15.4 trillion a year earlier
- AUD is a multi-rate jurisdication with AONIA & BBSW set to continue
In actual fact the OIS volume is even higher as we have allocated all of ASX’s volume to IRS, as we do not have a breakdown of this between IRS & OIS. In 2023 ASX volume was A$3.4 trillion, so some percentage of this, less than half would be OIS.
Next market share.
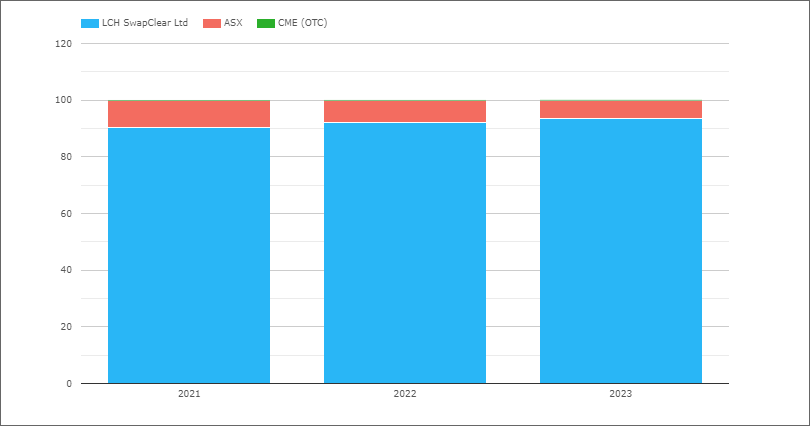
- 2023 share is LCH 93.5% and ASX 6.5%
- 2022 share was LCH 92%, ASX 8%
- 2021 share was LCH 90.4%, ASX 9.4%, CME 0.2%
LCH gaining share with the much higher increase in AONIA volume over the 3-year period.
CAD Swaps (CDOR, CORRA)
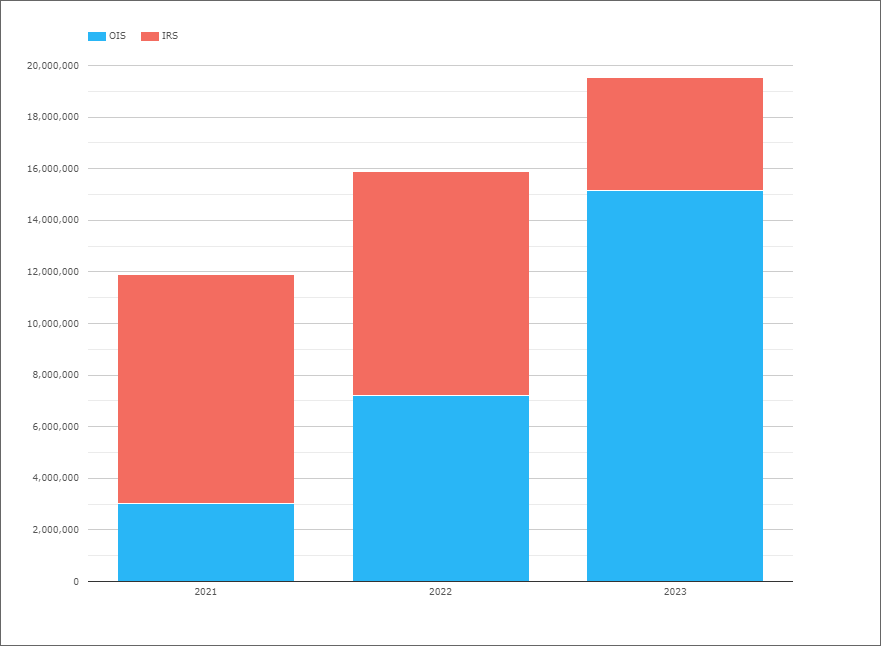
- IRS (CDOR) down to C$4.4 trillion in 2023 from C$8.7 trillion a year earlier
- OIS (CORRA) increasing to C$15.2 trillion from C$7.2 trillion a year earlier
- CORRA First clearly making a difference
- LCH SwapClear with 99.9% of the volume
EMEA Swaps
Now let’s switch to EMEA Swaps (all types) and volumes by currency.
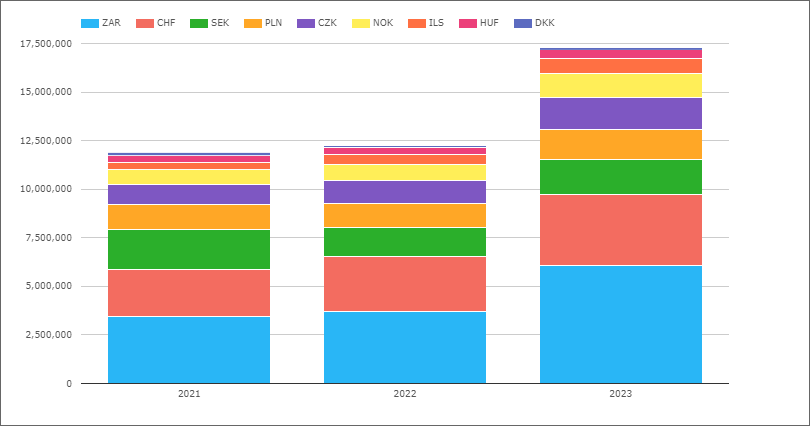
- 2023 with $17.3 trillion, up from $12.25 trillion in 2022, an increase of 41%
- ZAR the largest currency with $6.1 trillion in 2023, up from $3.7 trillion, an increase of 65%
- CHF with $3.7 trillion, up from $2.8 trillion, an increase of 32%
- SEK with $1.8 trillion, up from $1.5 trillion
- CZK with $1.62 trillion, up from $1.17 trillion
- PLN with $1.56 trillion, up from $1.26 trillion
- NOK with $1.23 trillion, up from $0.825 trillion, an increase of 49%
- ILS with $774 billion, up from $517 billion, an increase of 50%
- HUF with $456 billion, up from $332 billion, an increase of 37%
- DKK with $121 billion, down from $126 billion
Not shown in the chart is that LCH SwapClear has 99% of the overall EMEA 2023 volume.
The only currencies where LCH has less than 99% share are:
- CZK, with LCH 97.9%, EUREX 0.9%
- HUF, with LCH 95.8%, CME 4.2%
- PLN, with LCH 96.4%, CME 2%, KDPW 1.7%
Note: In SEK, we do not currently have any Nasdaq OMX SEK volume after May 2023 or open interest after June 2023. For prior months in 2023, Nasdaq volume was 1.2% and LCH 98.8%, which is a change from 2022 when Nasdaq had 3.9% share. One to investigate further and update in future.
AsiaPac Swaps
Now let’s switch to AsiaPac Swaps (all types) and volumes by currency.
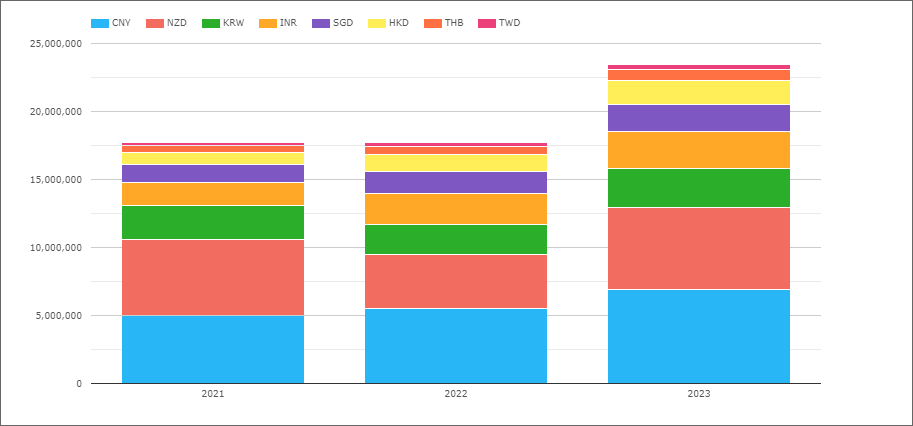
- 2023 with $23.5 trillion, up from $17.7 trillion, an increase of 33%
- CNY with $6.9 trillion, up from $5.5 trillion
- NZD with $6.0 trillion, up from $3.9 trillion, an increase of 54%
- KRW with $2.8 trillion, up from $2.2 trillion
- INR with $2.7 trillion, up from $2.3 trillion
- SGD with $2.0 trillion, up from $1.6 trillion
- HKD with $1.8 trillion, up from $1.2 trillion, an increase of 47%
- THB with $800 billion, up from $575 billion
- TWD with $353 billion, up from $342 billion
Not shown in the chart is that LCH SwapClear has 77% of the overall AsiaPac 2023 volume.
The only currencies where LCH has less than 100% share are:
- CNY, with Shanghai Clearing 63.2%, LCH 36.7%, HKEX 0.1%
- INR, with LCH 67.3%, CCIL 32.7%
- HKD, with LCH 98.6%, HKEX 1%, CME 0.4%
And before we leave AsiaPac, lets look at Cross Currency Swaps, all at HKEX.
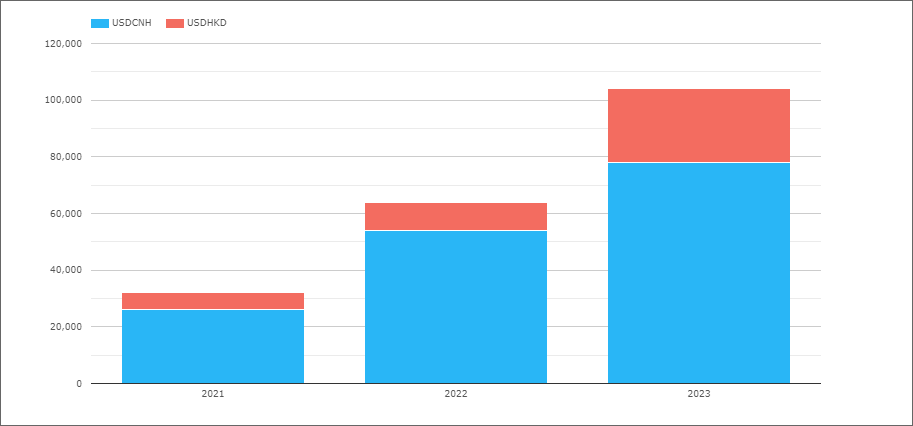
- USDCNH up to $78 billion from $54 billion a year earlier, an increase of 44%
- USDHKD up to $26 billion from $10 billion, an increase of 260%
LatAm Swaps
And last but not least, LatAm Swaps.
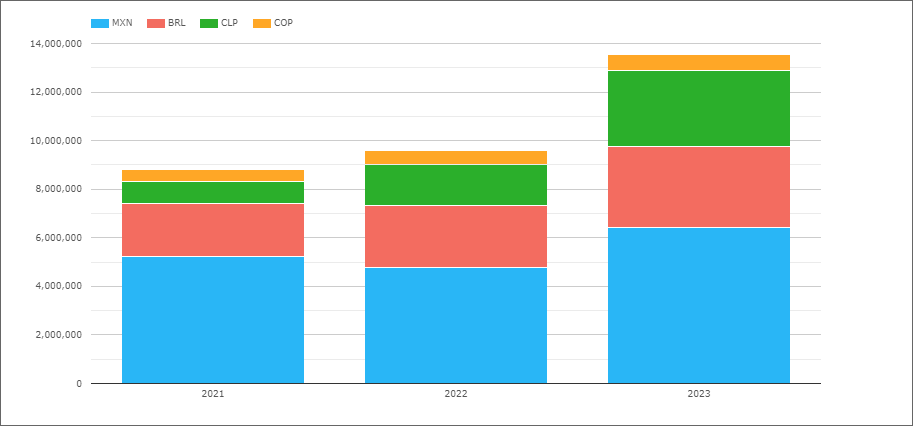
- 2023 with $13.6 trillion, up from $9.6 trillion in 2022, an increase of 42%
- MXN the largest with $6.4 trillion, up from $4.8 trillion
- BRL with $3.3 trillion, up from $2.55 trillion
- CLP with $3.1 trillion, up from $1.7 trillion, an increase of 82%
- COP with $690 billion, up from $550 billion
Not shown in the chart is that CME has >98% share in 2023 each of these currencies except MXN, where CME had 86.6%, Asigna/Mexder with 11.2% and LCH with 2.2%.
That’s It
Only 15 Charts for an overview.
There is a lot more data to look at.
Quarterly, monthly, weekly and by tenor.
IR Futures in all the major currencies.
US Treasury volumes.
Credit Derivatives and FX Derivatives.
For more details on any of the above.
Please contact us for information on CCPView.