This blog expands to the whole of 2025 the blog we published last September covering H1 2025 SDR-reported IR compression. Key takeaways
For 2025 as a whole:
- SDR-reported cleared IR compression volumes of OIS, fixed float IRS, and basis swaps surged to $170 trillion notional — up 73 percent from $98 trillion in 2024.
- The growth was powered by disproportionate volumes of off-platform compression of cleared trades. This reflects greater urgency among dealers than among clients to immediately compress the surging new trade volumes in 2025.
- Cleared OIS compression was $151 trillion – up 80 percent year-on-year (YoY).
- Cleared fixed float IRS compression was $16.9 trillion – up 28 percent YoY.
- Cleared basis swap compression was $1.76 trillion – up 212 percent YoY.
Background
SDR-reported IR compression volumes include SEF compression and bilateral compression but exclude the following:
- CCPs’ compression services include netting, coupon blending, and processing multilateral vendor compression. CCPs often report compression volumes on their websites.
- Non-CCP third-party vendors provide multilateral compression of cleared or uncleared trades, often using the CCPs’ compression processing infrastructure. The vendors report volumes using an approved publication arrangement (APA) service.
As well as the prior blog linked above, further background on SDR-reported IR compression is available in 2024 US SDR-Reported IR Compression. I will limit duplication of the prior blog, so keep it open for reference while reading on.
Overall volumes
All SDR-reported IR compression activity for all products and currencies in 2025 and 2024 is summarized in the following two charts.
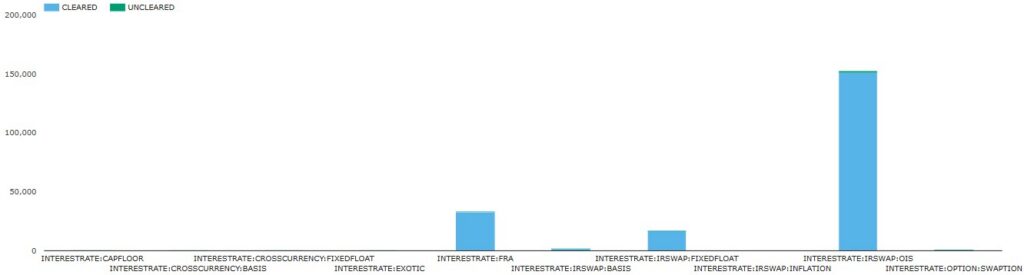
Chart 1a: 2025 US-reported IR compression notional volumes by product and cleared versus uncleared (USD billions). Source: SDRView
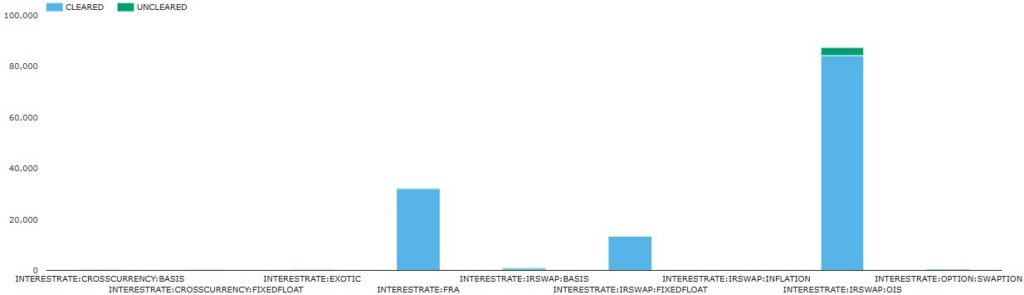
Chart 1b: 2024 US-reported IR compression notional volumes by product, cleared versus uncleared (USD billions). Source: SDRView
Note the different x-axis scales between charts 1a and 1b. The charts illustrate the cleared compression activity totaling $203 trillion in 2025 – up 57 percent YoY from $130 trillion in 2024.
- Cleared OIS compression led with $151 trillion – up a massive 80 percent YoY from $84.1 trillion.
- Cleared FRAs were next with $33.1 trillion – up 3.3 percent YoY from $32.0 trillion. This reflects low growth in reset optimization vendor run activity, as described in our blog reset optimization. We will blog again on this soon.
- Cleared fixed float swaps (IRS) had $16.9 trillion – up 28 percent YoY from $13.2 trillion.
- Cleared basis swaps had $1.76 trillion – up all of 212 percent YoY from $564 billion.
- Cleared inflation swaps had $58.3 billion – up 5.8 percent YoY from $55.1 billion. OSTTRA Reset dominates inflation swap compression, which we will cover in a separate blog soon.
The uncleared compression activity illustrated in Charts 1 and 2 totaled $2.64 trillion in 2025 – down 27 percent YoY from $3.62 trillion in 2024.
- Uncleared OIS had $1.72 trillion – down 47 percent YoY from $3.26 trillion.
- Uncleared swaptions had $875 billion – up 172 percent YoY from $322 billion, reflecting strong growth in uncleared IM optimization vendor activity, as described in our blog rates IM optimization. We will blog again on this soon.
- Uncleared cross-currency swaps had $23.8 billion – up 33 percent YoY from $18.0 billion.
- Uncleared IRS had $15.9 billion – down 11 percent YoY from $17.8 billion.
- Other uncleared products had $1.63 billion – down 70 percent YoY from $5.37 billion.
For brevity, we exclude cleared FRA and inflation swap compression and all uncleared compression from the rest of this blog. This leaves for further examination cleared compression of OIS, IRS, and basis swaps whose 2025 combined volumes were $170 trillion – up from $97.9 trillion in 2024.
OIS compression
We look at month-by-month volumes by currency.
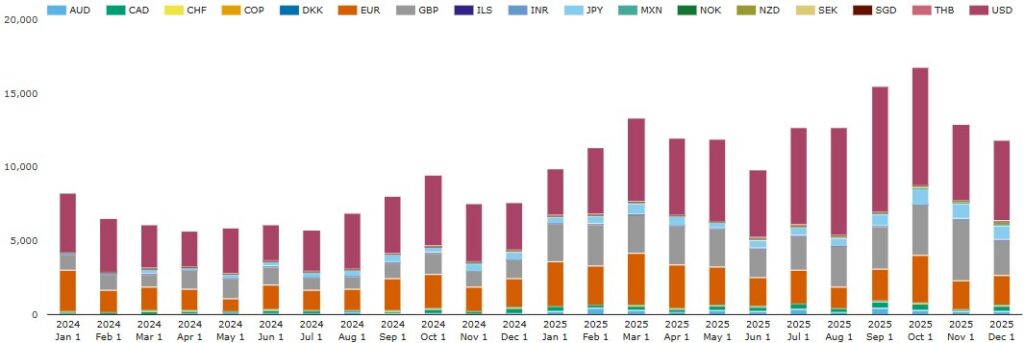
Chart 3: US-reported cleared OIS compression notional volumes by currency (USD billions). Source: SDRView
Note that we removed OIS in BRL, CLP, and KRW as these currencies would only have small volumes OIS because of reporting anomalies.
Chart 3 shows the month and currency breakdown of the $151 trillion 2025 cleared OIS compression in Chart 1a. Every month in 2025 had more volume than every month in 2024. October 2025 had the highest volumes ever with $16.8 trillion — up from $15.5 trillion in September 2025, the previous record month. October 2025 was up 79 percent on the same month a year earlier.
The six major currencies were $148 trillion of the 2025 volume – up 80 percent YoY.
- USD was the largest with $69.9 trillion – up 70 percent YoY.
- GBP was next largest with $33.1 trillion – up 146 percent YoY.
- EUR had $29.6 trillion – up 44 percent YoY.
- JPY had $8.02 trillion – up 99 percent YoY.
- CAD had $3.66 trillion – up 92 percent YoY.
- AUD had $3.22 trillion – up 226 percent YoY.
The next seven currencies (NZD, MXN, CHF, INR, SGD, THB, COP) were $2.97 trillion – up 82 percent YoY.
The remaining four currencies (ILS, SEK, NOK, DKK) were $98.7 billion – up from 4.5 billion in 2024, due to the ILS SHIBOR cessation in mid-2025 (see our recent blog), and the recent shift to RFR in Scandinavian currencies.
Now we chart platform shares.

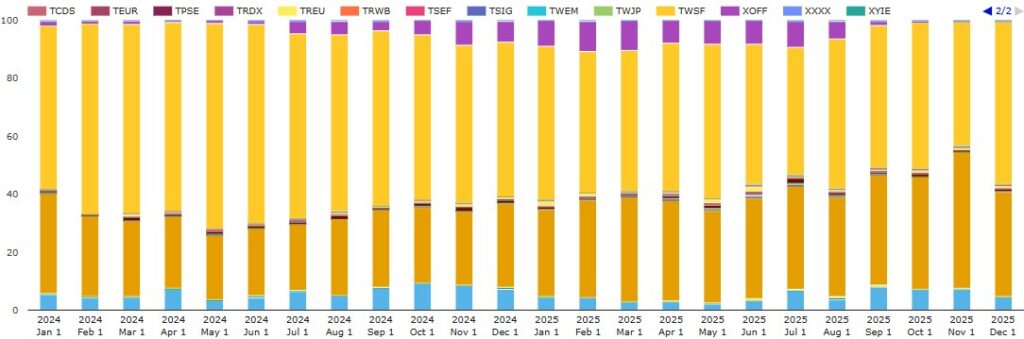
Chart 4: US-reported cleared OIS compression volume shares by platform (percentage of USD notional). Source: SDRView
Chart 4 illustrates the platform shares of the same volumes as in chart 3. The figures can be used to generate full-year 2025 and 2024 market shares.
- Off-platform (three platform IDs led by BILT and XOFF) had 42.3 percent – up from 29.9 percent YoY.
- Tradeweb (five platforms led by TWSF) was the main D2C platform group with a 51.0 percent share – down from 62.4 percent YoY.
- Bloomberg (three platforms led by BBSF) was the only other D2C platform group with 4.8 percent – down from 6.0 percent YoY.
- OSTTRA Reset (REST) had 0.63 percent – down from 0.87 percent YoY. I separate OSTTRA from other dealer-to-dealer (D2D) platform groups as it is a known session-based bulk termination process.
- Other D2D platform groups (BGC, TP, Tradition, and ICAP) totaled 1.11 percent – up from 0.76 percent YoY. These platforms are shown in the chart as the slivers sandwiched between the larger shares listed above.
In summary, off-platform activity took 12.4 percent from platform activity, as off-platform cleared compression activity more than doubled.
Cleared fixed float IRS compression
First, we look at month-by-month volumes by platform.
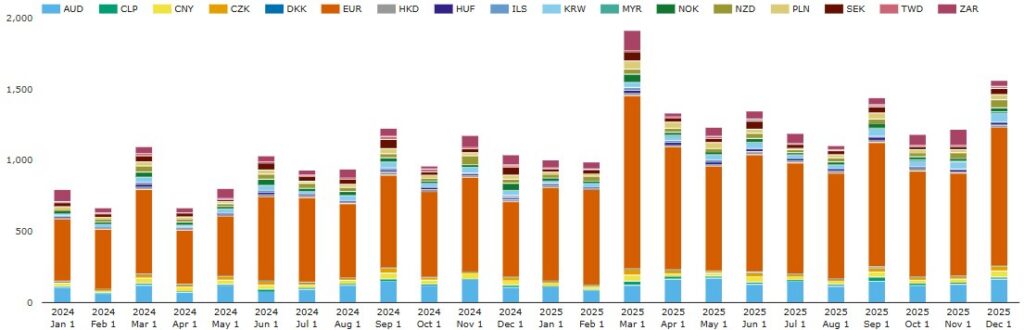
Chart 5: US-reported fixed float IRS compression notional volumes by currency (USD billions). Source: SDRView
Note that we removed about $1.3 trillion of IRS in currencies transitioned to OIS (USD, GBP, JPY, CAD, CHF, SGD, THB, MXN, INR, COP) because they would show a small volume of IRS only because of reporting anomalies.
Chart 5 shows the month-by-month platform breakdown of the remaining $15.5 trillion IRS volume in Chart 1a. March 2025 had record high volumes with $1.92 trillion, driven by peaks in EUR and three other European currencies. April, May, June, September, and December 2025 also exceeded the prior record in September 2024 of $1.22 trillion. The highlights of the currency breakdown follow:
- EUR had $9.84 trillion – up 53 percent YoY (faster YoY growth than EUR OIS).
- AUD had $1.62 trillion – up 22 percent YoY (slower YoY growth than AUD OIS).
- ZAR was the leading non-major currency with $793 billion – up 20 percent YoY.
- KRW had $458 billion – up 29 percent YoY.
- SEK had $417 billion – down 5.9 percent YoY (reflecting the shift to OIS in that currency).
- NZD had $405 billion – up 16 percent YoY.
- CNY had $355 billion – up 2.2 percent YoY.
- PLN had $342 billion – up 31 percent YoY.
- NOK had $276 billion – down 8.5 percent YoY (reflecting the shift to OIS in that currency).
- CZK had $260 billion – up 1.9 percent YoY.
- The remaining 11 currencies (HUF, HKD, CLP, TWD, ILS, MYR, DKK) totaled $756 billion – up 25 percent YoY.
Now, we look at IRS shares by platform.

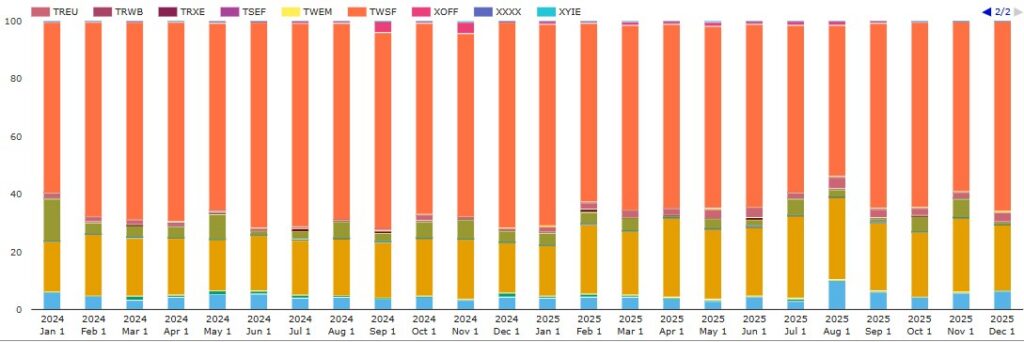
Chart 6: US-reported IRS compression volumes shares by platform (percentage of USD notional). Source: SDRView
Chart 6 illustrates the platform shares of the same volumes as in chart 4. The figures can be used to generate full-year 2025 and 2024 market shares. 2025 shares were as follows.
- Off-platform (three platform IDs led by BILT and XOFF) had 25.2 percent – up from 20.5 percent YoY.
- Tradeweb (five platforms led by TWSF) was the main D2C platform group with 65.4 percent – down from 68.6 percent YoY.
- Bloomberg (three platforms led by BBSF) was the only other D2C platform group with 4.93 percent – up from 4.49 percent YoY.
- OSTTRA Reset (REST) was the only D2D platform with material volume at 3.49 percent – down from 5.31 percent YoY.
- Other dealer-to-dealer (D2D) platforms (BGC, TP, ICAP, and Tradition) totaled 0.96 percent – down from 1.07 percent YoY. These platforms are shown in the chart as the slivers sandwiched between the larger shares.
In summary, off-platform activity took 4.7 percent in IRS compression share from platform activity.
Cleared basis swap compression
By platform and currency, the basis swap compression volumes look like this.

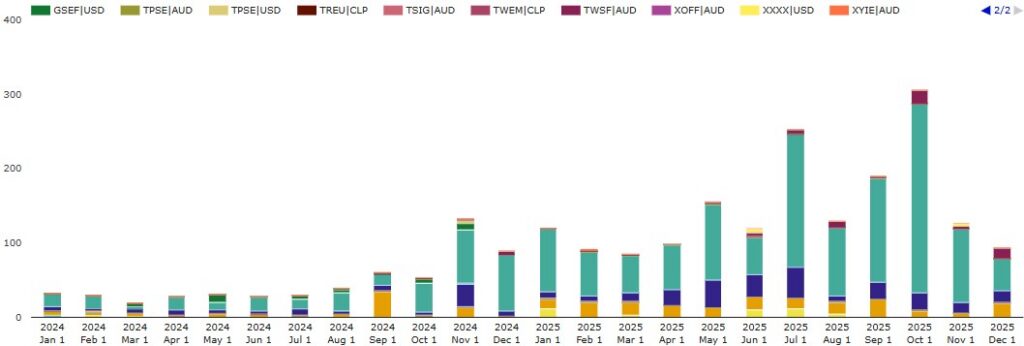
Chart 7: US-reported basis swap compression notional volumes by platform and currency (USD billions). Source: SDRView
Chart 7 shows the month-by-month breakdown of the 2025 $1.76 trillion basis swap compression volumes in Chart 1a – up 212 percent YoY. In 2025, October was a new record month with $306 billion while May, July, and September each beat the old record set in November 2024 of $132 billion.
- Off-platform (BILT, XXXX and XOFF) dominated with 93.9 percent of 2025 volume – up from 89.6 percent YoY. The share was led by USD FedFunds versus SOFR with 68.9 percent, and the RFR-untransitioned majors – EUR with 13.7 percent, AUD with 10.4 percent.
- D2C platforms had 3.3 percent of 2025 basis swap compression (led by Tradeweb AUD) – up from 1.1 percent YoY.
- D2D platforms had 2.9 percent – down from 8.9 percent YoY. USD basis swap compression was 2.2 percent (led by BGC (BGCD)) – up from 0.9 percent YoY. AUD was the remaining 0.7 percent (led by TP and BGC). Notably, BGC’s GSEF was absent in 2025 after a 2024 share of 6.9 percent.
Here, off-platform increased its dominant share in 2025.
End note
- That is all for now. To recap the key takeaways, see the section near the top.
- Watch this space for regular coverage of this topic going forward, and for separate blogs on FRA, swaption and inflation swap compression.
- Contact us if you are interested in using SDRView.