- The ISDA-Clarus RFR Adoption Indicator includes currency specific measures on how much RFR risk is trading.
- These values are available as interactive charts on rfr.clarusft.com.
- Notable adoption of RFRs has occurred in both GBP markets (40%) and CHF (8%).
- We look at each of the six currencies covered by the indicator in this blog.
Data vs Perception
Speaking to people this week, I’ve noticed distinct differences in how people measure “market activity”. With brokers, it is always actual traded volume. From bank sales people, it might be about the numbers of client enquiries. For traders, it tends to be about the big-ticket risk trades.
It’s therefore useful to have hard data. The ISDA-Clarus RFR Adoption Indicators measure how much risk is transacted in cleared derivatives in six currencies. Splitting this out currency-by-currency via our new interactive charts therefore allows us to state definitively how advanced each interest rate derivative market is in terms of RFR adoption – as measured by trading activity.
GBP
In the monthly report, Charts 5a and 5b show the proportion of risk traded versus an RFR in each currency.
Due to the vast differences between currencies in the percentage of risk traded as an RFR product, we find this particular data is more satisfying to look at via the interactive charts at rfr.clarusft.com.
First up, GBP:
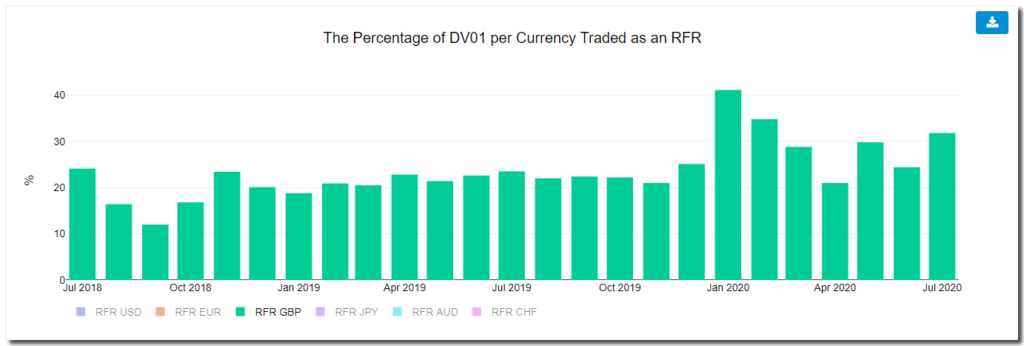
Showing;
- Up to 40% of risk is traded versus SONIA in GBP markets.
- This is across both OTC derivatives and futures (exchange traded derivatives).
- It covers all maturities.
- The high point for SONIA trading was in January 2020, when 41% of all risk was traded versus SONIA.
- This has receded somewhat to stand at 32% in July 2020 (the third highest month on record).
- Q4 2019 saw 23% of risk traded versus SONIA. The last three month period saw 29%. It is not massive growth, but the time-series shows RFR trading is increasing over time.
USD
The SOFR market in USD is clearly not as developed as SONIA – it is a relatively new benchmark. However, trading is noticeably picking up:
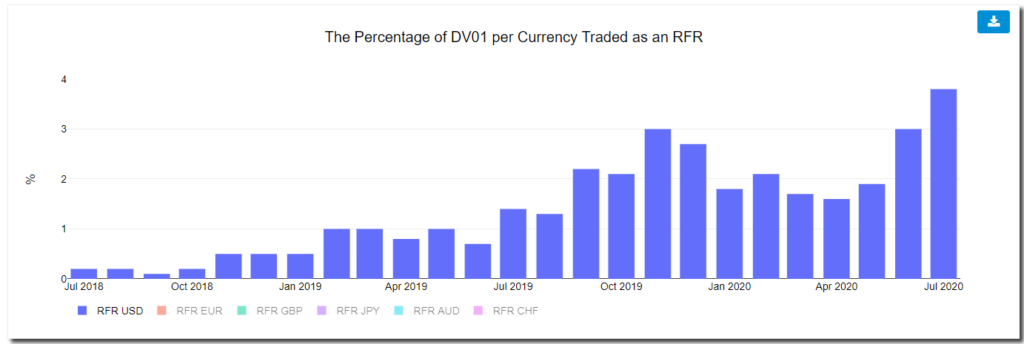
Showing;
- Back-to-back records for the proportion of risk traded versus SOFR in USD markets.
- June saw 3%, July 3.8%. Small portions, but a healthy trend.
- This covers activity across both OTC and futures remember. It is impressive how much larger SOFR futures are than OTC for example.
- Contact us for a CCPView subscription to see all of the input data for this fast developing market.
EUR
EUR €STR markets saw the discounting switch from EONIA to €STR at the very end of July 2020. We really need to see the August data (coming soon!) to notice any pick-up in activity:
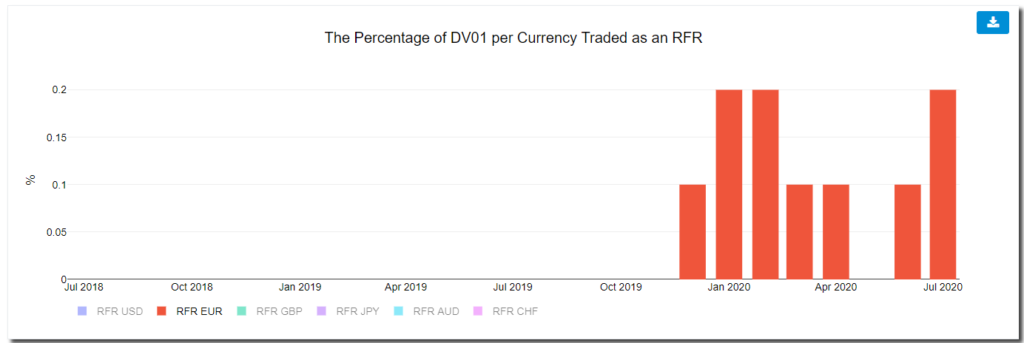
Just 0.2% of risk is being transacted versus €STR right now. It will be fascinating to see the impact that the CCP discounting switch has had on this activity.
CHF
CHF has the potential to claim the second most developed RFR market, after SONIA.
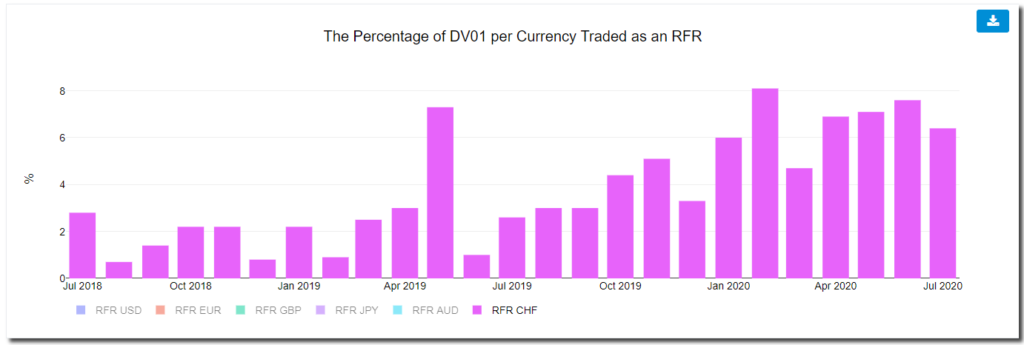
Showing;
- Up to 8% of CHF DV01 risk is transacted versus SARON each month.
- The past four months have been very stable at 6.5-7.5%.
- This is a long way behind GBP markets, but is still a secure second place overall. Helped I’m sure relative to USD and EUR by there being only one tradeable index for OIS (SARON, with the demise of TOIS all the way back in 2017).
- Whilst the TOIS transition was relatively smooth back then, it resulted in a market that traded sporadically for a while. That wouldn’t be a great outcome for the already liquidity-constrained CHF IRS market this time around.
JPY
Finally, in terms of the LIBOR currencies, we have the enigmatic JPY market:
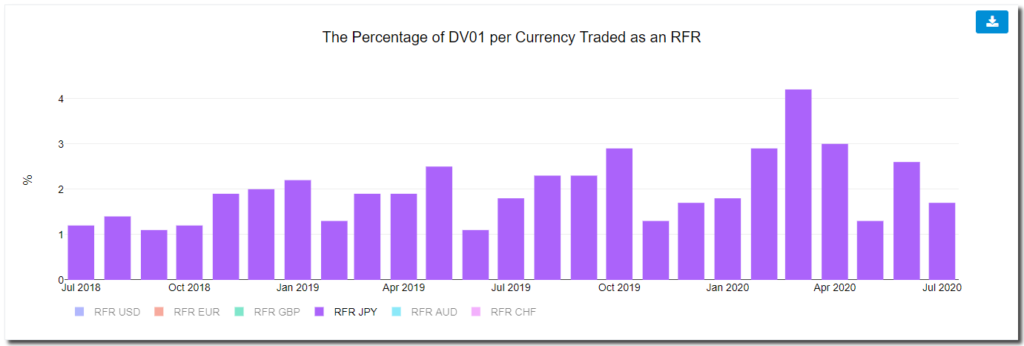
Showing;
- Probably the most worrying in terms of a transition story that we have seen of all currencies.
- Even at peak times, only ~4% of risk is traded versus TONA, which in all other respects is a well established OIS market.
- The trend does not look positive either, with July 2020 recording less than 2% of all JPY DV01 transacted versus the RFR index, TONA.
- Transition seems to be lagging in JPY markets.
AUD
With BBSW set to be around for a while, we have the potential for a slightly different dynamic in AUD markets in terms of RFR (AONIA) activity:
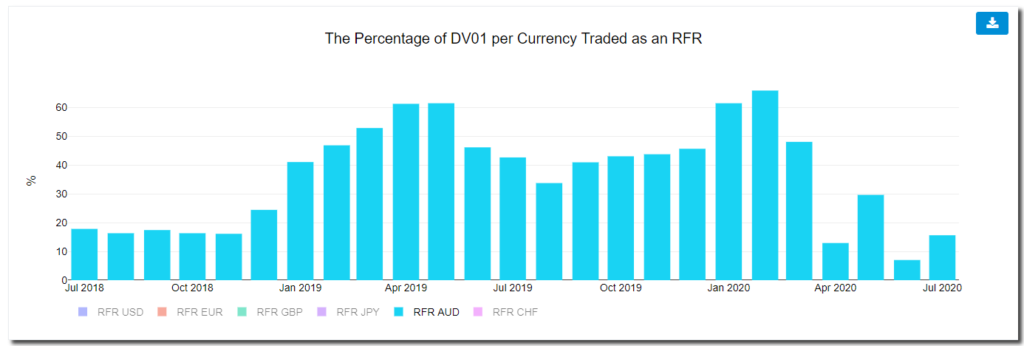
Showing;
- The percentage of DV01 risk traded versus AONIA is extremely volatile each month.
- In July 2020, 16% of DV01 risk was traded versus the RFR (AONIA).
- This compares with all-time highs of 66% (!) earlier in 2020. These peaks are even higher than in GBP markets.
- However, it looks like activity in AONIA may be impacted by market expectations of central bank activity. It will be intriguing to see how this evolves over the coming months.
In Summary
- GBP markets see the highest proportion of overall trading activity taking place against an RFR.
- This suggests that GBP markets are best positioned for the transition away from LIBOR.
- In GBP, up to 40% of overall risk is traded versus SONIA in any given month.
- Other markets see different dynamics at play, resulting in widely differing levels of RFR activity.
- It is important to keep on top of the data as the transition away from LIBOR accelerates.