This blog covers the volumes, of credit derivatives (CRD) in September 2025, as submitted to us by CCPs, and as reported to US SDRs and SBSDRs.
Key takeaways:
A year-on-year (YoY) comparison of notional volumes between September 2025 and September 2024 shows that:
- Cleared CRD were up 30 percent.
- In USD, cleared CRD grew by 36 percent, SDR-reported CRD were up 60 percent, but SBSDR-reported CRD were down 11.3 percent.
- In EUR, cleared CRD grew by 23 percent, SDR-reported CRD were up 20 percent, but SBSDR-reported CRD were down 19 percent.
- In JPY, cleared CRD were down 18 percent, SDR-reported CRD were down 4.8 percent, and SBSDR-reported CRD were down 10.9 percent.
All the charts, data, and statistics in this blog were sourced from CCPView and SDRView.
Cleared CRD volumes
First, we look at cleared CRD by currency.

Chart 1: All CRD by CCP and currency (notional USD millions). Source: CCPView.
Chart 1 shows that all-currency CRD were $5.42 trillion in September 2025, up 30 percent from September 2024, or year-on-year (YoY), and up 6.1 percent from March 2025, or half-on-half (HoH). September 2025 is a new record, and both September and March 2025 finally surpassed the long-standing previous record of $4.44 trillion set in March 2020.
- USD CRD were $3.20 trillion, up percent 36 percent YoY, and up 6.9 percent HoH. ICE Clear Credit (in blue) had 91.1 percent, but LCH CDSClear (in orange) had 8.9 percent and grew faster at 120 percent YoY.
- EUR CRD were $2.21 trillion, up 23 percent YoY, and up 4.9 percent HoH. ICE Clear Credit (in red) had 75.2 percent, but LCH CDSClear (in green) had 24.8 percent and grew faster at 31 percent YoY.
- JPY CRD (in purple) were $530 million, down 18 percent YoY, and down 49 percent HoH. All JPY CRD cleared at JSCC.
You will have noticed the pattern of CRD peak months in March and September. We get more information about peak months from a daily plot that includes those months.
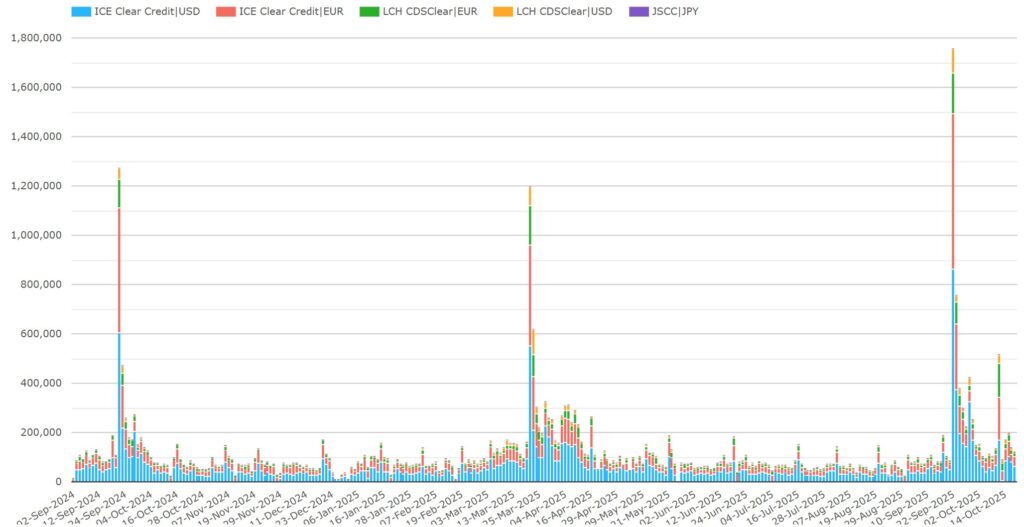
Chart 2: All CRD by CCP and currency (notional USD millions). Source: CCPView.
Chart 2 shows peak days on 20 September 2024, 20 March 2025 and 22 September each year. There is also heightened activity for several days after these peaks.
The dates are just after the IMM dates in those months, which fall on the third Wednesday of the last month in the quarter. The corresponding IMM dates to those above were 19 September 2024, 19 March 2025 and 17 September 2025. This is no coincidence. In 2002, the CRD market adopted standard maturities to simplify processing and help reduce the substantial number of post-trade breaks across the industry. The industry chose March and September IMM dates.
Hedges maturing on these two dates will often be extended or “rolled over”. This results in increased volume near the date and peak volume days just after the maturity date – when cover has stopped on many contracts not already rolled over.. Sometimes, the increase continues into the following month, as we see for April 2025 in charts 1 and 2.
Now we look at CRD by product for each currency, starting with USD.
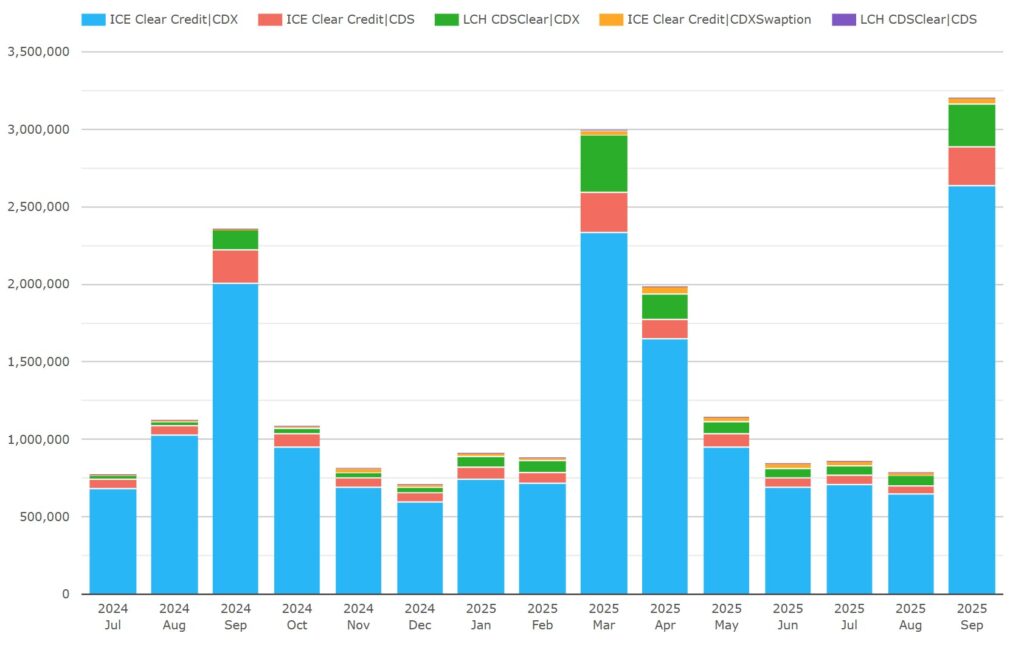
Chart 3: USD CRD by CCP and product (notional USD millions). Source: CCPView.
Chart 3 breaks down the $3.20 trillion USD CRD from chart 1 by CCP and product.
- CDX were $2.92 trillion, up 37 percent YoY, and up 7.9 percent HoH. Of CDX, ICE Clear Credit (in blue) had 90.3 percent, while LCH CDS Clear (in green) had 9.7 percent, but grew faster at 121 percent YoY.
- Single-names (CDS) were $248 billion, up 13.2 percent YoY, but down 5.8 percent HoH. ICE Clear Credit (in red) had 99.2 percent, while LCH CDSClear had 0.8 percent but grew faster at 62 percent YoY.
- CDX swaptions were $37.4 billion, up 258 percent YoY, and up 27 percent HoH. These were all at ICE.
We move on to EUR CRD by CCP and product.
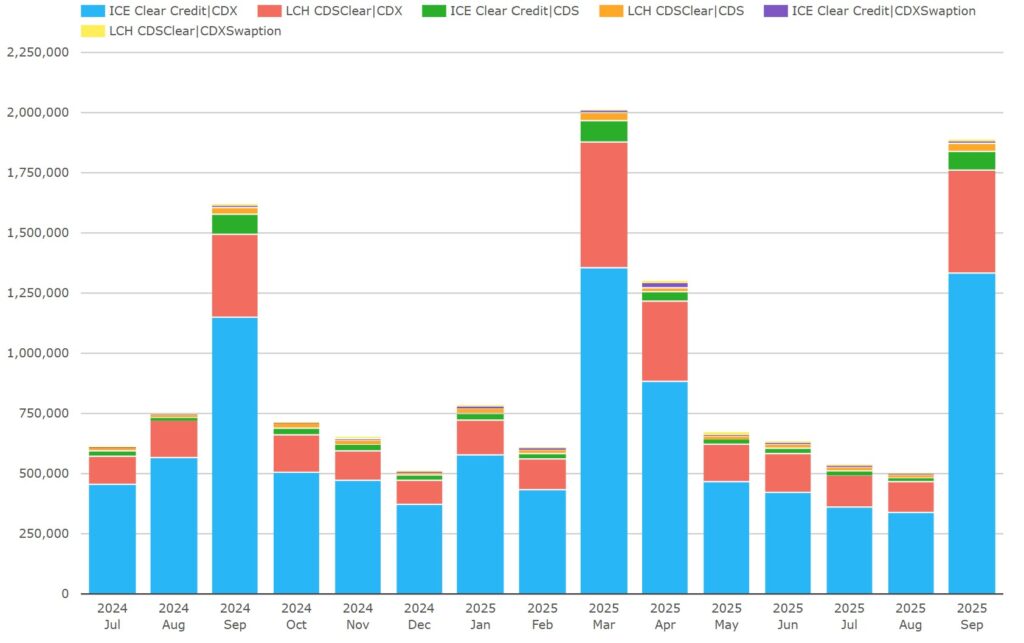
Chart 4: EUR CRD by CCP and product (notional EUR millions). Source: CCPView.
Chart 4 shows that $2.20 trillion EUR CRD shown in chart 1 was €1.89 trillion in trade currency.
- iTraxx (CDX) were $1.76 trillion, up 18 percent YoY, but down 6.2 percent HoH. ICE Clear Credit (in blue) had 75.9 percent, while LCH CDSClear (in red) had 24.1 percent, but grew faster at 24 percent YoY.
- Single-names (CDS) were $115 billion, flat YoY, but down 8.9 percent HoH. ICE Clear Credit (in green) had 68.8 percent, while LCH CDSClear (in orange) had 31.2 percent, but grew at 21 percent YoY.
- CDX swaptions were $14.8 billion, up 10.2 percent YoY, and up 54 percent HoH. ICE Clear Credit (in purple) had 55.4 percent, while LCH CDSClear (in yellow) had 44.6 percent, but grew at 14.9 percent YoY.
Next, we look at JPY CRD volumes by product. JPY CDS follow the same March and September IMM maturity dates pattern as USD and EUR. However, JSCC CDS clearing happens weekly on Thursdays including trades executed up to the previous week. Much of the increased rollover activity immediately after the third Wednesday of March or September does not clear until the Thursday two weeks and one day after the IMM date which is in the following month. Therefore, April and October are often the peak months of the year.
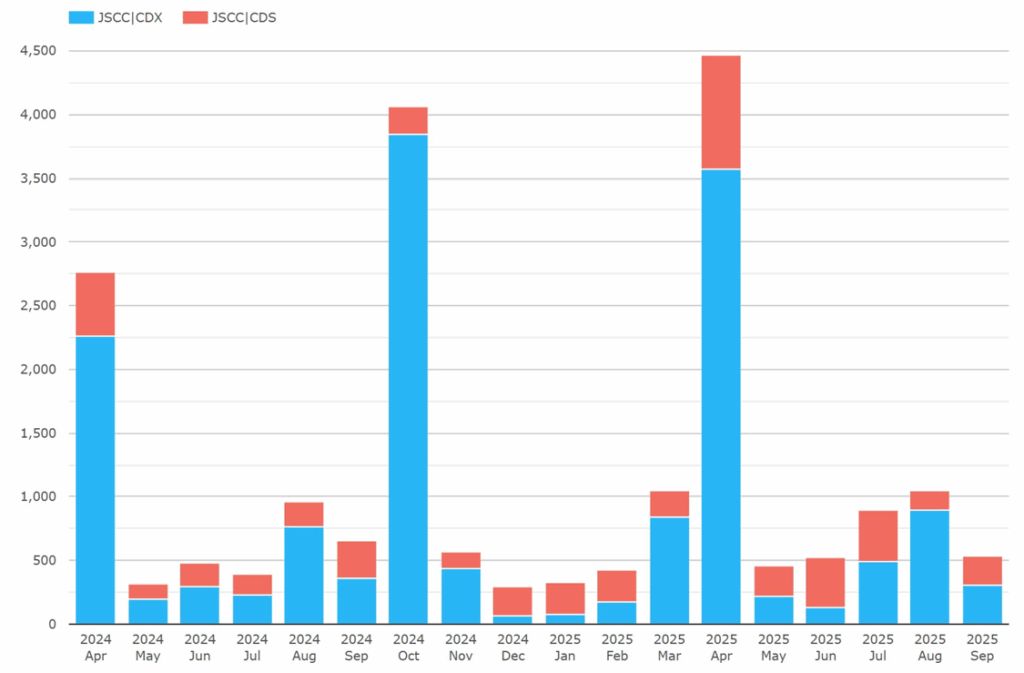
Chart 5: JPY CRD by product (notional JPY millions). Source: CCPView.
Chart 5 shows that the trade currency equivalent of the $530 million of JPY CRD in chart 1 was ¥78.1 billion. However, this was not a peak month for the reason noted above. Below, I instead compare April 2025 volumes YoY with April 2024, and HoH with October 2024. (I added Q2 2024 to the chart for this purpose.)
Chart 5 shows that JPY CRD (all cleared at JSCC) were $5.42 trillion in April 2025, up 159 percent YoY (on April 2024), and up 14.4 percent HoH (on October 2024).
- CDX were ¥534 billion, up 156 percent YoY, but down 3.5 percent HoH.
- Single-names (CDS) were ¥134 billion, up 175 percent YoY, and up 337 percent HoH.
After noting the September CCPs shares in-line above, is the faster LCH growth than ICE in September part of making sustained inroads into ICE’s market share lead?
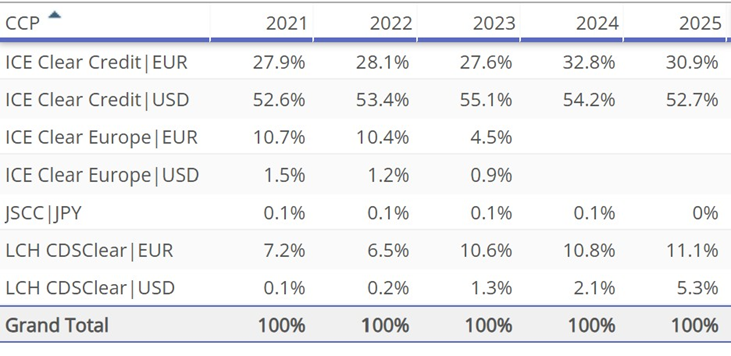
Table 1: Cleared CRD share by CCP and product (percentage of $ equivalent notional). Source: CCPView.
Table 1 shows a longer-range view with whole years from 2022 to 2024 plus 2025 year to end September.
- In 2021 and 2022, ICE Clear Europe CRD clearing had a total of about 12 percent cleared CRD share, mostly in EUR products.
- By 2024, ICE Clear Europe was gone, and LCH CDSClear and ICE Clear Credit total shares had increased by about 6 percent each from 2022.
- 2025 to date shows a 3.4 percent shift from ICE to LCH, but only the full year figures will be definitive.
SDR- and SBSDR-reported CRD
CRD are reported to swap data repositories (SDRs) where they are based on indexes or baskets with more than ten names. CRD are reported to security-based swap data repositories (SBSDRs) where they are single-name CDS or baskets with ten names or less. We start with USD CRD.
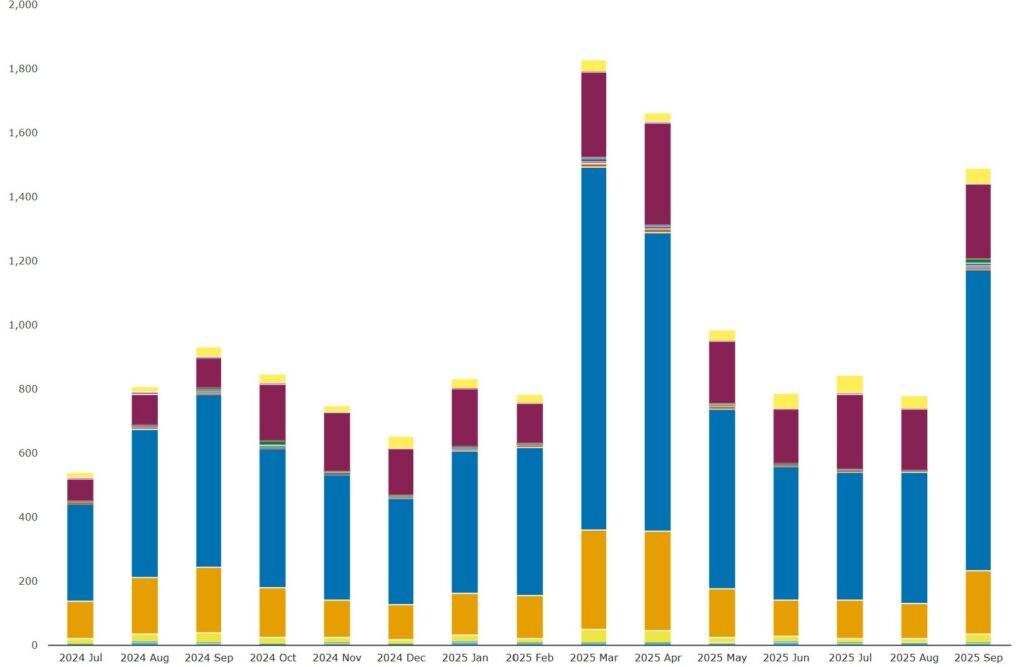
Chart 6a: SDR-reported USD CRD by product type (notional USD billions). Source: SDRView.

Chart 6b: SBSDR-reported USD CRD by product type (notional USD millions). Source: SDRView.
Chart 6a shows that September 2025 SDR-reported USD CRD totaled $1.49 trillion, up 60 percent YoY, but down 19 percent HoH.
- Indexes were $1.18 trillion, up 50 percent YoY, but down 22 percent HoH. The largest index type was investment grade CDX (dark blue) at $938 billion, followed by high yield CDX (orange) at $196 billion, and emerging markets CDX (yellow) at $29.4 billion.
- Swaptions (claret) were $231 billion, up 145 percent YoY, but down 12.8 percent HoH.
- Total return swaps (bright yellow) were $51.2 billion, up 61 percent YoY, and up 36 percent HoH.
- Index tranches made up the remaining $16.3 billion.
Chart 6b shows that September 2025 SBSDR-reported USD CRD totaled $65.6 billion, flat YoY, but down 11.3 percent HoH.
- Single names (CDS, in blue) were $62.2 billion, down 2.8 percent YoY, and down 13.4 percent HoH.
- Total return swaps (TRS, in green) were $3.00 billion, up 81 percent YoY, and up 71 percent HoH.
Now, we look at EUR CRD.
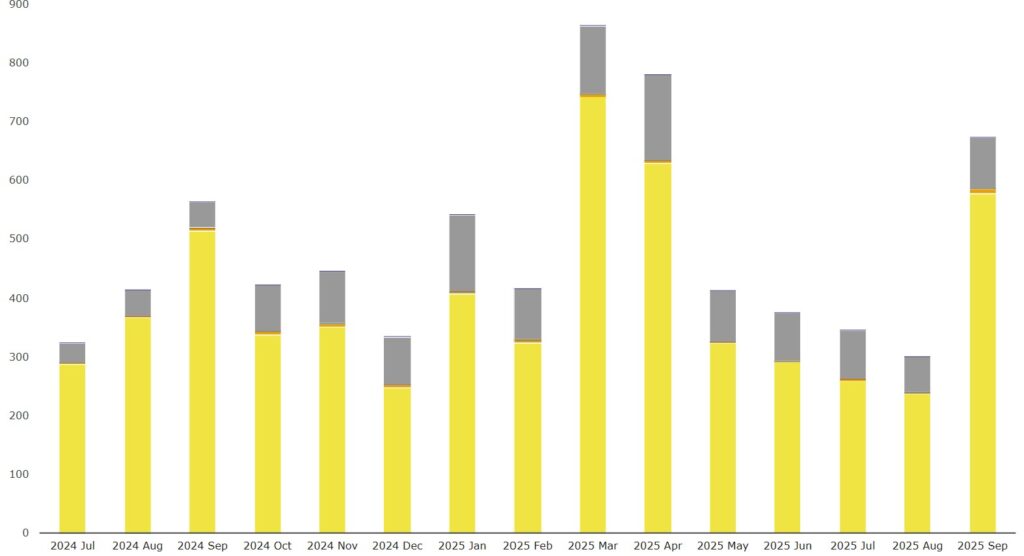
Chart 7a: SDR-reported EUR CRD by product type (notional EUR billions). Source: SDRView.

Chart 7b: SBSDR-reported EUR CRD by product type (notional EUR millions). Source: SDRView.
Chart 7a shows that September 2025 SDR-reported EUR CRD totaled €673 billion, up 20 percent YoY, but down 22 percent HoH.
- Indexes (all iTraxx Europe, yellow) were €575 billion, up 12 percent YoY, but down 22 percent HoH.
- Swaptions (also all iTraxx Europe, gray) were €87.9 billion, up 99 percent YoY, but down 24 percent HoH.
- The remaining volume comprised tranches at €8.37 billion, total return swaps at €1.16 billion, and exotics at €693 million.
Chart 7b shows that September 2025 SBSDR-reported EUR CRD totaled €18.3 billion, down 19 percent YoY, and down 12.8 percent HoH. Almost all were single-names (CDS).
Now we look at JPY CRD.

Chart 8a: SDR-reported JPY CRD by product type (notional JPY billions). Source: SDRView.
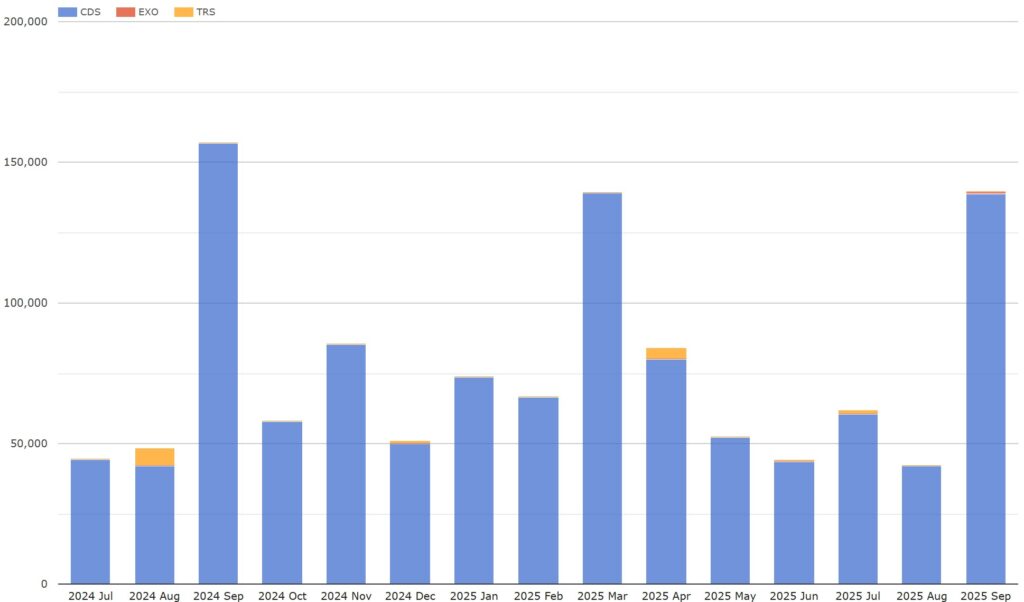
Chart 8b: SBSDR-reported JPY CRD by product type (notional JPY millions). Source: SDRView.
Chart 8a shows that September 2025 SDR-reported JPY CRD totaled ¥225 billion, down 4.8 percent YoY, and down 28 percent HoH. Almost all were iTraxx Japan trades.
Chart 8b shows that September 2025 SBSDR-reported JPY CRD totaled ¥140 billion, down 10.9 percent YoY, and flat HoH. Almost all were single-names.
There are small volumes of CRD in a handful of other currencies, but I will let users of SDRView or SBSDRView users explore this further.
That’s It
We used five charts and a table to cover cleared CRD, and three charts to review each of SDR- and SBSDR-reported CRD.
You can find a lot more data in CCPView, SDRView and SBSDRView. Click each link to see a summary of the range of data available.
Contact us if you are interested in a subscription.