This blog covers the volumes of FX derivatives (FXD) in September 2025, as reported by CCPs and to US SDRs.
Key takeaways:
A year-on-year (YoY) comparison of volumes between September 2025 and September 2024 shows that:
- September was a new record month for all cleared FXD, up 34 percent; and cleared NDFs, up by 25 percent.
- Cleared FX options grew by 107 percent, led by EUR and JPY, which increased by 138 percent and 166 percent, respectively.
- Cleared forwards rose by 99 percent.
- SDR-reported NDFs on non-deliverable pairs increased 4.2 percent.
- SDR-reported NDFs on deliverable pairs grew by 91 percent, indicating that FX IM optimization activity is growing at a faster rate than day-to-day FX trading.
- SDR-reported vanilla FX options rose 9.7 percent.
Analysis by product group showed that clearing rates for NDFs on deliverable pairs are aligned with those for FX options rather than those for NDFs on non-deliverable pairs.
All the charts and details in this blog were sourced from CCPView and SDRView.
Cleared FXD volumes
First, we look at cleared FXD by product type: non-deliverable forwards (NDFs), options, forwards, and spot.
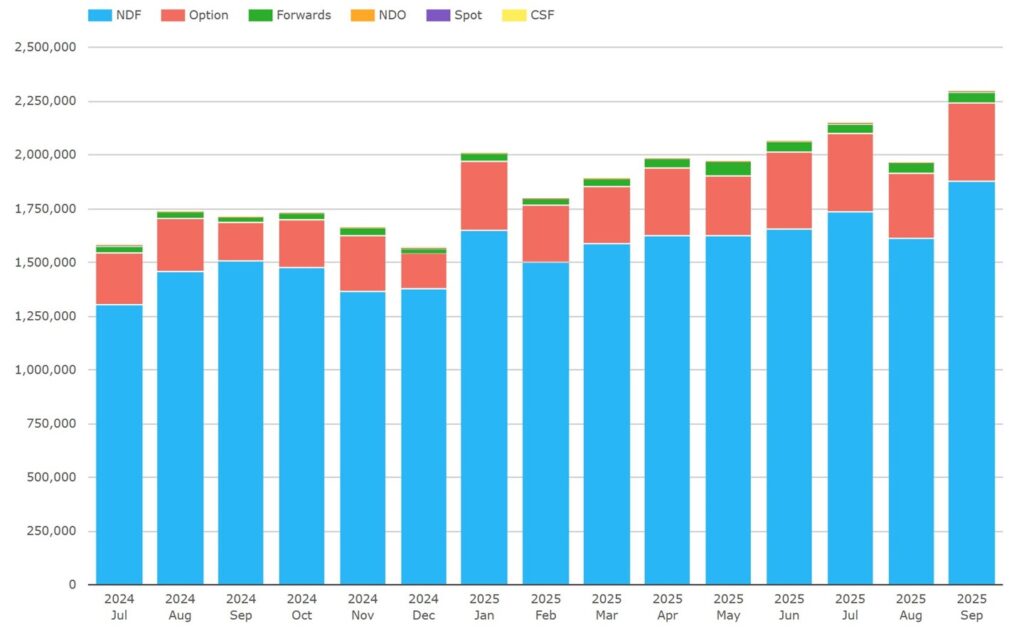
Chart 1: Cleared FXD by product (notional $ millions). Source: CCPView.
Chart 1 shows that cleared FXD notional volumes were $2.29 trillion in September 2025, up 34 percent YoY from $1.71 trillion in September 2024, and up 11.2 percent QoQ from $2.06 trillion in June 2025. The $2.29 trillion is a new record as were July, June, and January 2025 at the time.
- NDFs were by far the largest at $1.88 trillion, up 25 percent YoY, and up 13.4 percent QoQ. September was a new record as were July, June, and January 2025 at the time.
- FX options were $364 billion, up 107 percent YoY, and up 2.2 percent QoQ. September was second only to July 2025 at $365 billion.
- Forwards were $51 billion, up 99 percent YoY, and up 2.6 percent QoQ. September was second only to May 2025 at $68.9 billion.
- Non-deliverable options (NDOs) were $2.35 billion, up 181 percent YoY, but down 18 percent QoQ.
- Spot was $1.10 billion, down 43 percent YoY, and down 27 percent QoQ.
Taken together, FX options and deliverable forwards more than doubled YoY, and grew their share of cleared FXD from 12 percent to 18 percent.
Let us dig into NDFs, starting with NDFs on non-deliverable pairs.

Chart 2: Cleared NDFs on non-deliverable currency pairs (notional $ millions). Source: CCPView.
Chart 2 shows that of $1.88 trillion cleared NDFs in chart 1, NDFs on non-deliverable pairs were $1.82 trillion.
We can highlight the consistent top five currency pairs.
- INR was the largest at $420 billion, up 13.4 percent YoY, and up 6.5 percent QoQ.
- TWD was next at $374 billion, up 20 percent YoY, and up 0.7 percent QoQ.
- KRW was $322 billion, up 18 percent YoY, and up 9.4 percent QoQ.
- BRL was $261 billion, up 28 percent YoY, and up 18 percent QoQ.
- IDR was $131 billion, up 43 percent YoY, and up 42 percent QoQ.
Next, we show NDFs on deliverable pairs by currency.
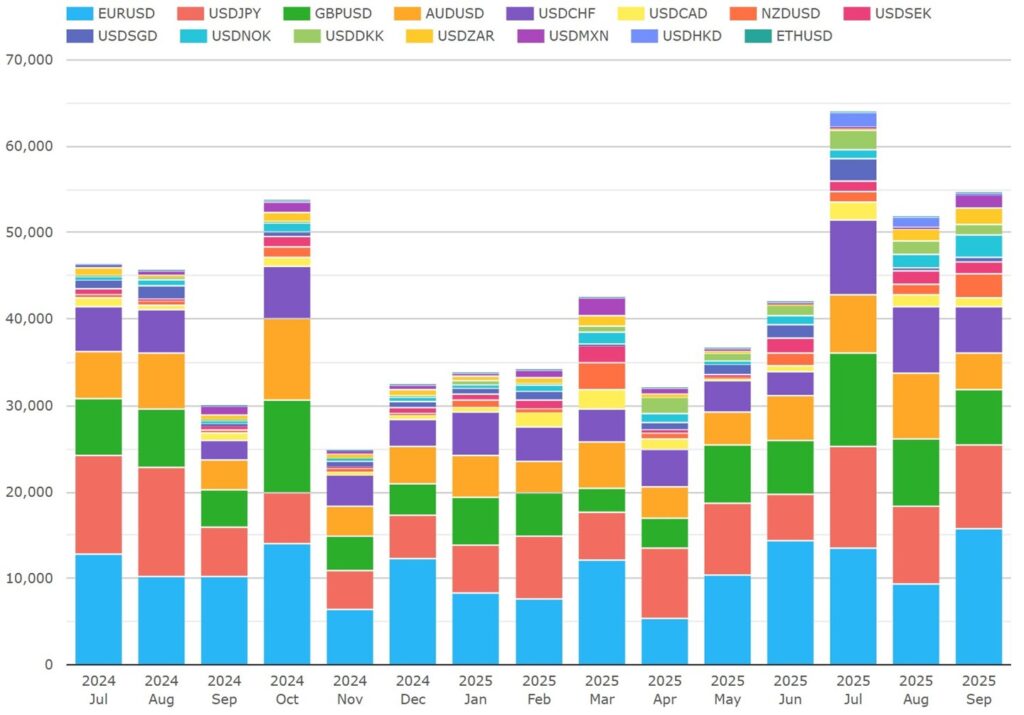
Chart 3: Cleared NDFs on deliverable currency pairs (notional $ millions). Source: CCPView.
Chart 3 shows that deliverable pair NDFs were $54 billion, up 82 percent YoY, and up 30 percent QoQ. We can highlight the consistent top five currency pairs.
- EUR was the largest at $15.7 billion, up 55 percent YoY, and up 8.8 percent QoQ.
- JPY was next at $9.79 billion, up 72 percent YoY, and up 85 percent QoQ.
- GBP was $6.33 billion, up 42 percent YoY, and flat QoQ.
- CHF was $5.28 billion, up 132 percent YoY, and up 93 percent QoQ.
- AUD was $4.23 billion, up 24 percent YoY, but down 18 percent QoQ.
- Five other deliverable currencies – NZD, ZAR, SEK, NOK, and DKK – were $9.78 trillion, up YoY from $1.77 trillion, a five-and-a-half-fold increase.
- HKD started to have consistent cleared NDF activity from July 2025 onwards. We will keep an eye on progress going forward.
The last two points suggest adoption of regular cleared hedges for those six currencies by more vendors and / or participants in FX IM optimization runs.
Now, we look at NDFs market share by CCP.

Chart 4: CCP shares of volume of cleared NDFs (notional percentage). Source: CCPView.
Chart 4 shows ForexClear continuing to dominate market share.
- LCH ForexClear had 99.4 percent in September 2025, up YoY from 98.6 percent, and up QoQ from 99.3 percent.
- Comder had 0.5 percent, down YoY from 1.3 percent, and down QoQ from 0.6 percent.
- CME OTC was 0.1 percent, flat YoY, and flat QoQ.
Moving onto FX options, cleared volumes break down as follows.
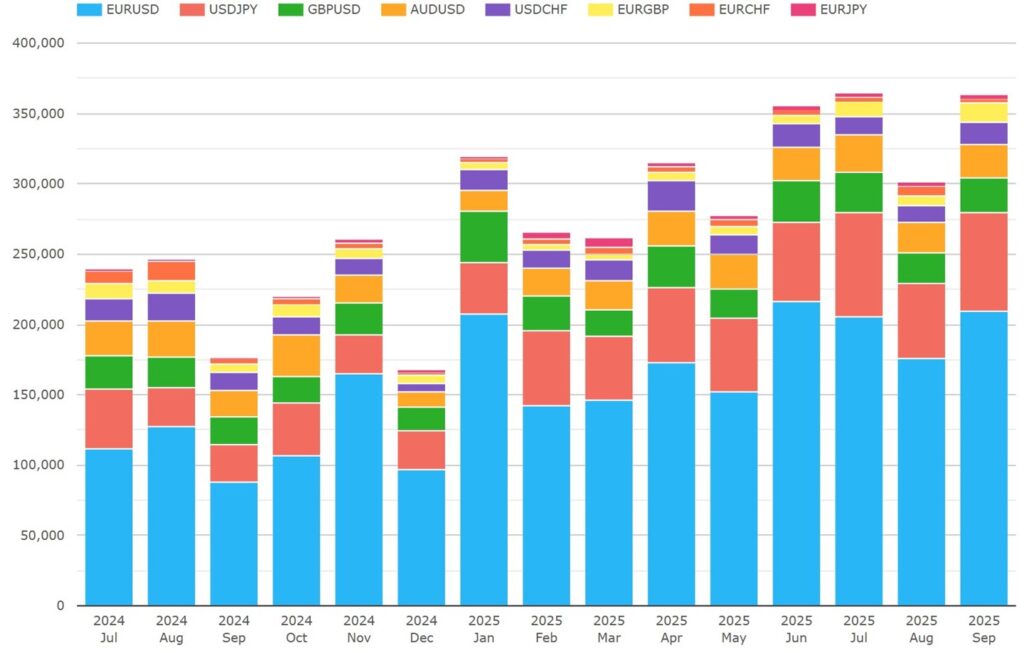
Chart 5: Cleared FX options on all currency pairs (notional $ millions). Source: CCPView.
Chart 5 enables us to break down the $364 billion cleared FX options shown in chart 1 to the top five currencies level.
- EUR was by far the largest at $209 billion, up 138 percent YoY, but down 3.2 percent QoQ.
- JPY was next at $70.0 billion, up 166 percent YoY, and up 23 percent QoQ.
- GBP was next at $25.1 billion, up 26 percent YoY, but down 15 percent QoQ.
- AUD was next at $23.5 billion, up 22 percent YoY, but down 0.8 percent QoQ.
- CHF was next at $15.8 billion, up 21 percent YoY, but down 3.5 percent QoQ.
All FX options were cleared at LCH ForexClear.
SDR-reported FXD volumes
Now, we look at SDR-reported FXD, starting with NDFs on non-deliverable pairs.
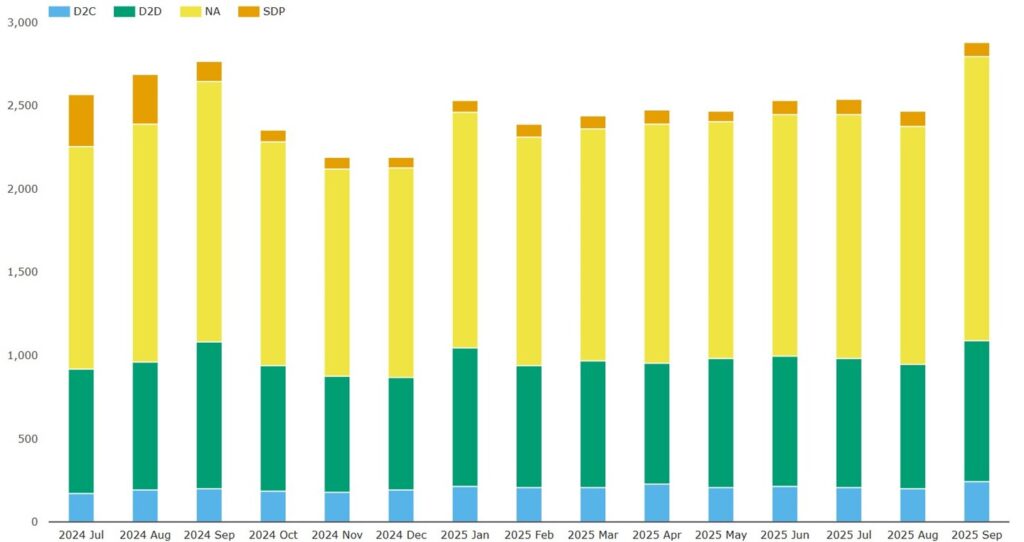
Chart 6: SDR-reported NDFs on non-deliverable pairs by platform type (notional $ billions). Source: SDRView.
Chart 6 shows that SDR-reported volumes of NDF on non-deliverable pairs rose to $2.88 trillion in September 2025, up 4.2 percent YoY, and up 14 percent QoQ. That month was second only to the record of $3.16 trillion set in January 2024.
- Off-platform activity (NA) was the largest at $1.71 trillion, up 8.8 percent YoY, and up 17 percent QoQ.
- Dealer-to-dealer (D2D) platforms were next with $844 billion, down 4.1 percent YoY, but up 7.7 percent QoQ.
- Dealer-to-client (D2C) platformshad $241 billion, up 22 percent YoY, and up 14 percent QoQ.
- Single-dealer platforms (SDP) had $91.2 billion, down 23 percent YoY, but up 14 percent QoQ.
During Q3 2025, in the early part of the chart, SDP volumes took a step down. Drilling down by platform id shows that the Citibank SDP platforms – CBNL, CGML, and CGMD – last had NDF volumes reported in September 2024. This leaves J.P. Morgan (JPCB and JPSI) and HSBC as the only SDPs with NDF volumes reported.
Now, we look at SDR-reported NDFs by currency pair.
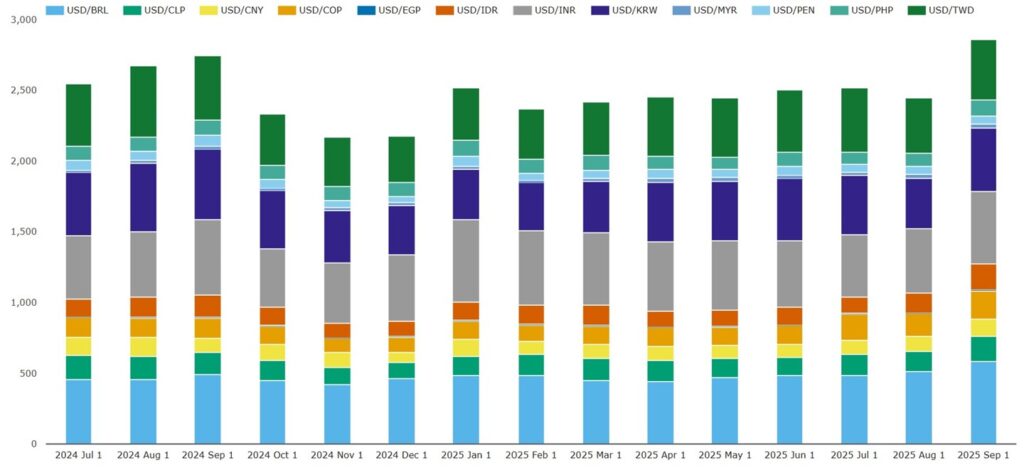
Chart 7: SDR-reported NDFs on top 12 non-deliverable pairs (notional $ millions). Source: CCPView.
Chart 7 shows that the top 12 non-deliverable pairs accounted for $2.86 trillion (over 99 percent) of the above $2.88 trillion of SDR-reported NDFs on non-deliverable pairs. We can highlight the largest pairs by volume.
- BRL was the largest at $584 billion, up 19 percent YoY, and up 22 percent QoQ.
- INR was next at $514 billion, down 2.9 percent YoY, but up 9.1 percent QoQ.
- KRW was $444 billion, down 10.7 percent YoY, and up 0.9 percent QoQ.
- TWD was next at $427 billion, down 5.1 percent YoY, and down 3.2 percent QoQ.
- COP was $199 billion, up 37 percent YoY, and up 47 percent QoQ.
- IDR was $182 billion, up 13.5 percent YoY, and up 47 percent QoQ.
- CLP was $177 billion, up 13.5 percent YoY, and up 32 percent QoQ.
- CNY was $123 billion, up 27 percent YoY, and up 41 percent QoQ.
We move on to SDR-reported deliverable pair NDFs.
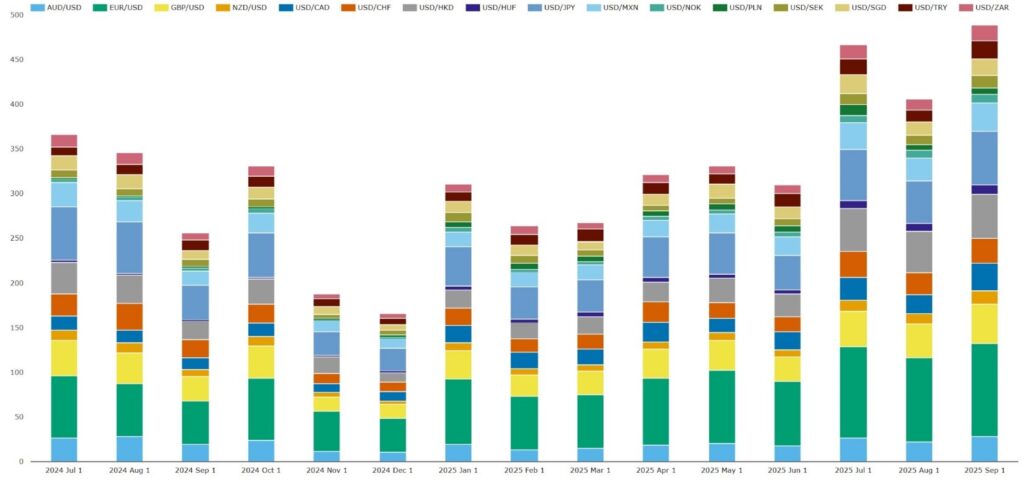
Chart 8: SDR-reported NDFs on the top 16 deliverable pairs (notional $ millions). Source: CCPView.
Chart 8 shows that the top 16 deliverable pairs accounted for $489 billion, which is over 99 percent of the total $493 billion of SDR-reported NDFs on deliverable pairs. The total is up 91 percent YoY, and up 58 percent QoQ.
- EUR (in green) was the largest at $104 billion, up 114 percent YoY, and up 44 percent QoQ.
- JPY (in mid-blue) was next at $59.9 billion, up 54 percent YoY, and up 55 percent QoQ.
- GBP (in yellow) was $43.7 billion, up 63 percent YoY, and up 61 percent QoQ.
- HKD (in gray) was $49.5 billion, up 139 percent YoY, and up 90 percent QoQ.
- MXN (in pale blue) was $31.1 billion, up 103 percent YoY, and up 49 percent QoQ.
Next, we look at SDR-reported FX options.
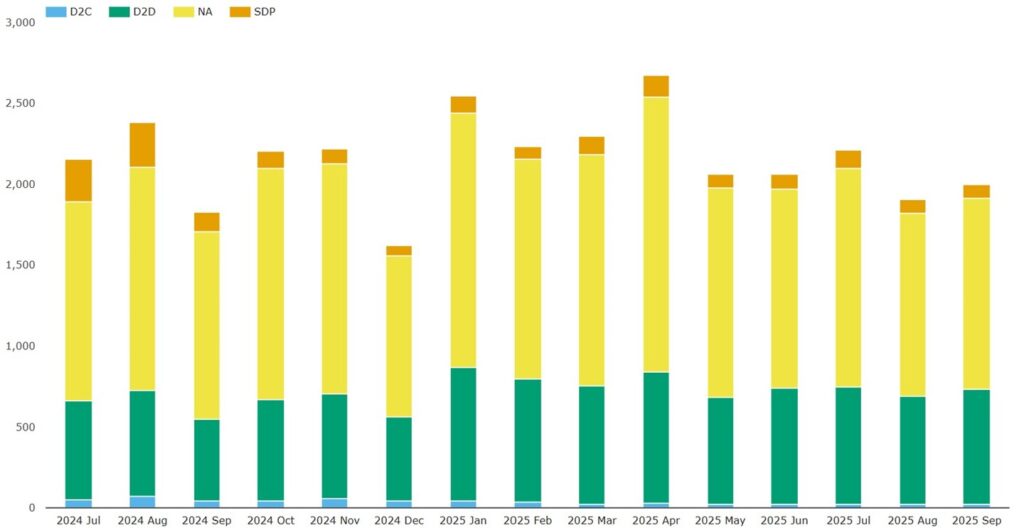
Chart 9: SDR-reported FX options by platform type (notional $ millions).
Chart 9 shows that SDR-reported FX options totaled $2.00 trillion in September 2025, up 9.7 percent YoY, but down 3.1 percent QoQ.
- Off-platform activity (NA) led with $1.18 trillion, up 1.8 percent YoY, but down 4.2 percent QoQ.
- D2D platforms were next with $710 billion, up 40 percent YoY, but down 1.3 percent QoQ.
- SDPs had $90.3 billion, down 22 percent YoY, and down 2.9 percent QoQ.
- D2C platformshad $20.9 billion, down 52 percent YoY, but up 3.6 percent QoQ.
Next, we look at SDR-reported vanilla FX options by currency pair. Here we limit to the top 14 pairs making up 89+ percent of the volume.
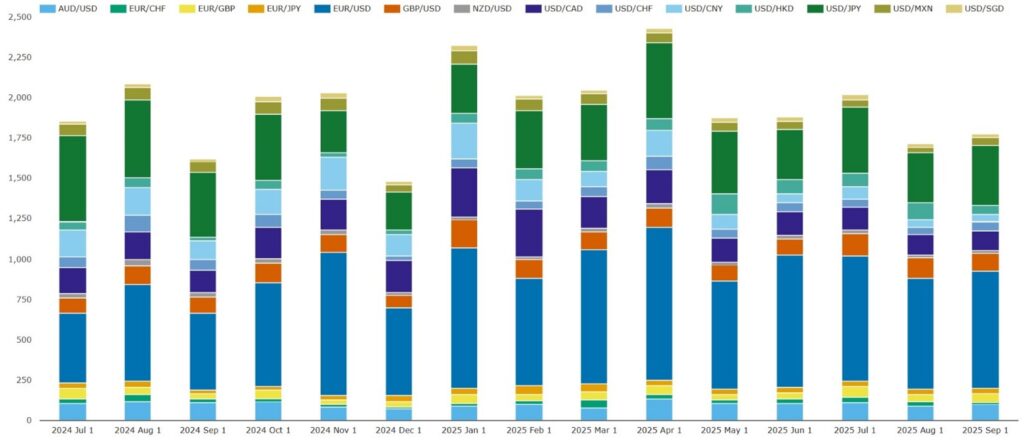
Chart 10: SDR-reported FX options for all currency pairs (notional $ millions).
Chart 10 shows that the SDR-reported FX options in the top 14 pairs totaled $1.78 trillion, which was 89 percent of the $2.00 trillion total of all pairs in September 2025.
- EUR was by far the largest at $722 billion, up 52 percent YoY, but down 11.7 percent QoQ.
- JPY was next at $367 billion, down 7.4 percent YoY, but up 19 percent QoQ.
- CAD was next at $122 billion, down 11.5 percent YoY, and down 17 percent QoQ.
- GBP was next at $114 billion, up 11.1 percent YoY, and up 13.8 percent QoQ.
- AUD was next at $100 billion, down 8.0 percent YoY, and down 5.9 percent QoQ.
- HKD was next at $55.8 billion, up 112 percent YoY, and down 38 percent QoQ.
- All the remaining currencies in the top 14 were down YoY and down QoQ, except EUR traded against GBP, which was $56.7 billion, up 65 percent YoY, and up 44 percent QoQ.
This is a mixed picture which balances YoY growth in EUR, GBP, and HKD volumes with YoY decline in the other currencies.
Comparing volume dynamics and clearing rates
As we set out in a recent blog, NDFs on deliverable pairs are not traded very much day-to-day but are produced by multilateral IM optimization runs. We split them from NDFs on non-deliverable pairs above, to enable comparison as if they were two separate product types.
We start with YoY volume growth rates:
- NDFs on non-deliverable pairs: YoY growth was 4.2 percent.
- NDFs on deliverable pairs: YoY growth was 91 percent.
- FX options: YoY growth was 9.7 percent.
This shows NDFs on deliverable pairs increasing much faster than the volumes in NDFs on non-deliverable pairs or in FX options. FX IM optimizations optimize the counterparty risk IM produced by FX options and produce most of the NDFs on deliverable pairs. The outsized growth in volumes of NDFs on deliverable pairs suggests a greater surge in optimization activity by vendors and participants than that indicated by the growth in the underlying FX risk alone.
We can also estimate clearing rates. We account for the missing non-SDR-reported volume by doubling the SDR-reported volume to get a (crude) global volume estimate. We then estimate the cleared ratio as the cleared volume as a percentage of the global volume estimate. This results in the following volumes and ratios for September 2025:
- NDFs on non-deliverable pairs: global – $5.76 trillion, cleared – $1.82 trillion, cleared ratio – 32 percent.
- NDFs on deliverable pairs: global – $986 billion, cleared – $54 billion, cleared ratio – 5.5 percent.
- FX options: global – $4.00 trillion, cleared – $364 billion, cleared ratio – 9.1 percent.
This shows that NDFs on deliverable pairs clear at similar rates to FX options rather than NDFs on non-deliverable pairs. This may be because FX IM optimization (which generates most NDFs on deliverable pairs) is focused on reducing the counterparty risk-driven IM generated by FX options.
That’s It
We used 10 charts to cover FXD.
You can find a lot more data in CCPView, including:
- Analysis by date, week, month, quarter, or year.
- Volume metrics beyond new trade notional to trade count, average daily volume (ADV), open interest, and notional unwound/matured.
- More granular CRD volumes at index series or single-name level.
- FXD volumes for exchange-traded derivatives.
Contact us if you are interested in a subscription.