This blog covers the volumes of FX derivatives (FXD) in Q1 2026, following on from our prior blog on Q4 2025 FXD volumes.
Key takeaways
Q1 2026 saw record notional volumes for all five cleared FXD products (non-deliverable FX forwards (NDFs), FX options, FX forwards, non-deliverable FX options (NDOs), and spot FX) and for SDR-reported NDFs and FX options.
- Cleared NDFs grew 40 percent year-on-year (YoY) and 23 percent quarter-on-quarter (QoQ) to reach $6.63 trillion.
- SDR-reported NDFs grew by 25 percent YoY and by 18 percent QoQ to reach $10.3 trillion.
- Crude estimates indicate that one third of global NDF volumes were cleared.
- Cleared FX options grew by 70 percent YoY and by 60 percent QoQ to reach $1.44 trillion.
- SDR-reported FX options were flat YoY but grew by 38 percent QoQ to reach $7.11 trillion.
- Crude estimates indicate that one ninth of global FX options volumes were cleared.
- Cleared FX forwards grew 49 percent YoY and 26 percent QoQ to reach $175 billion.
Read on for more analysis and further explanation.
All the charts and details in this blog were sourced from CCPView and SDRView.
Note on volume statistics
Cleared totals from CCPView are complete while SDR-reported totals from SDRView include only trades where a US party is on one or both sides.
SDR-reporting do include both uncleared and cleared trades, but trades are often reported uncleared even if clearing is initiated post-trade. To crudely estimate the cleared fraction of the volumes of an FXD product, we instead use the rule of thumb that SDR-reported volumes are roughly half the global total.
Cleared FXD volumes
We look at cleared FXD by product type: NDFs, FX options, FX forwards, NDOs, and spot.
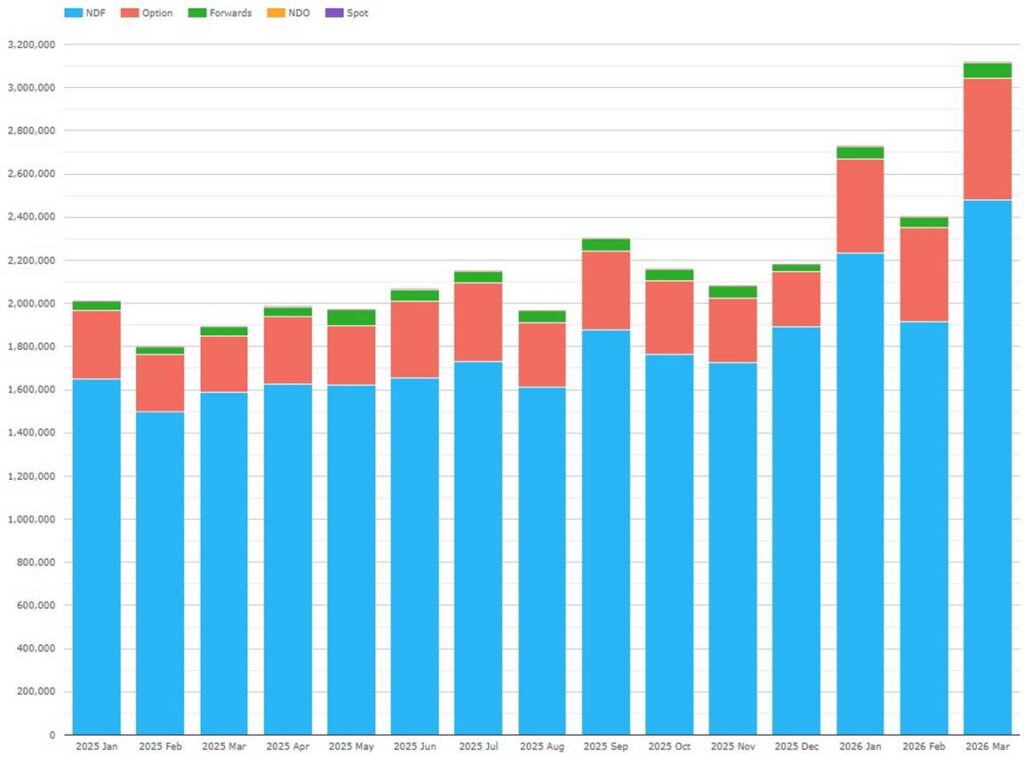
Chart 1: Cleared FXD by product (notional US$ millions). Source: CCPView
Chart 1 shows that all three months of Q1 2026 FXD volumes exceeded all previous months leading to a Q1 total of $8.25 trillion, a new record quarter – up 45 percent YoY and up 28 percent QoQ from the previous record of $6.43 trillion set in Q4 2025. All five products had a record quarter.
- NDFs were by far the largest with $6.63 trillion – up 40 percent YoY and up 23 percent QoQ.
- FX options were next largest with $1.44 trillion – up all of 70 percent YoY and up 60 percent QoQ.
- FX forwards were $175 billion – up 49 percent YoY and up 26 percent QoQ.
- NDOs were $7.59 billion – up 149 percent YoY and up 28 percent QoQ.
- Spot FX was $5.79 billion – up 43 percent YoY and up 30 percent QoQ.
The rest of this blog digs into cleared and SDR-reported NDFs, cleared and SDR-reported FX options and cleared FX forwards.
NDFs
We start with a currency breakdown of cleared NDFs
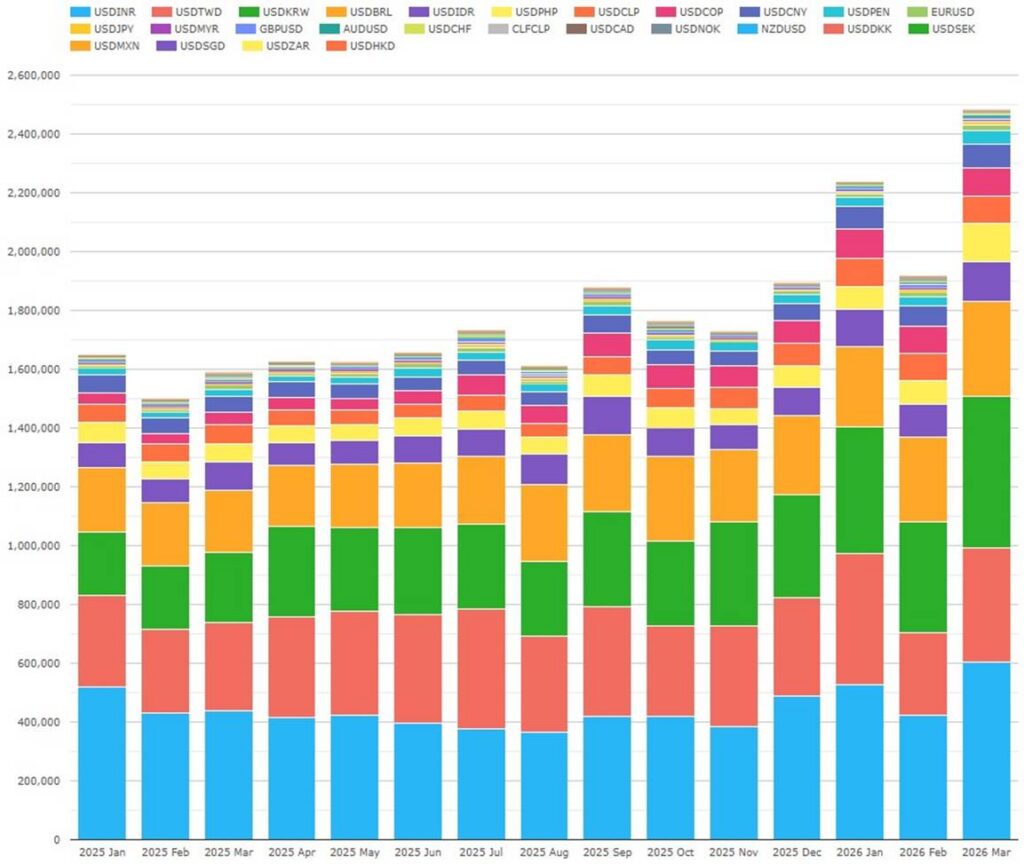
Chart 2: Cleared NDFs (notional US$ millions). Source: CCPView
Chart 2 breaks down by currency Chart 1’s record Q1 2026 NDF volumes of $6.63 trillion – up 40 percent YoY and up 23 percent QoQ. Of this, the twelve non-deliverable currency pairs made up $6.47 trillion (97.6 percent) of Q1 2026 NDF volume. We highlight the top five plus CNY.
- INR was the largest at $1.56 trillion – up 12 percent YoY.
- KRW was next at $132 trillion – up 97 percent YoY.
- TWD saw $1.11 trillion – up 25 percent YoY.
- BRL had $884 billion – up 37 percent YoY.
- IDR traded $373 billion – up 41 percent YoY.
- CNY was $227 billion – up 34 percent YoY, but was outstripped in volume by COP, PHP, and CLP.
Deliverable currencies made up the remaining $157 billion (2.4 percent), of which $126 billion (1.9 percent) comprised USD versus the five other major currencies.
Looking at CCP market share, LCH ForexClear continues to dominate cleared NDFs with 99.1 percent in Q1 2026 – up YoY from 98.3 percent. ComDer took most of the remainder while CME OTC had some trades. Given LCH’s dominance the chart is unilluminating, so I left it out.
Now, we look at SDR-reported NDFs.
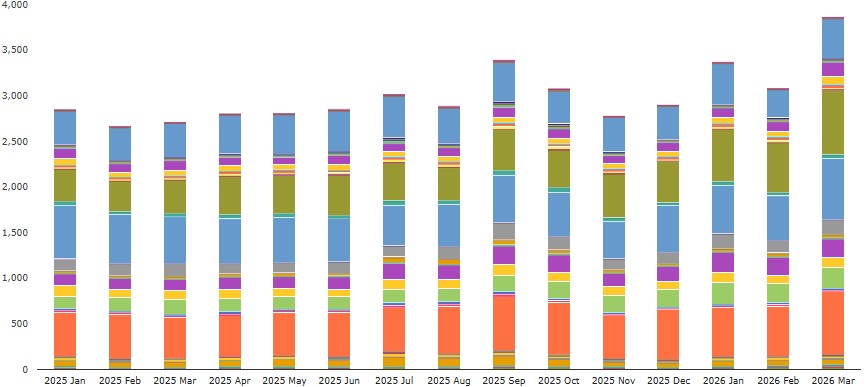
Chart 3: SDR-reported NDFs (notional US$ billions). Source: SDRView
Chart 3 shows that SDR-reported NDFs also had record volumes in Q1 2026 of $10.3 trillion. However, you can see that growth was less rapid – up 25 percent YoY and up 18 percent QoQ.
Of the total, NDFs on non-deliverable pairs were $9.36 trillion – up 27 percent YoY. Of this, the top 10 pairs versus USD were $9.14 trillion (leaving over 150 remaining pairs making up the remaining $221 billion). We highlight the top four currencies plus CNY versus USD.
- KRW (in dark green) overtook INR, BRL, and TWD to be the largest with $1.82 trillion – up 73 percent YoY.
- BRL (in dark orange) overtook INR for second largest at $1.78 trillion – up 25 percent YoY.
- INR (in paler blue) was next at $1.69 trillion – up 3.4 percent YoY.
- TWD (in darker blue) saw $1.20 trillion – up 8.7 percent YoY.
- CNY (in bright yellow) had $318 billion – up 1.7 percent YoY, but was outstripped by CLP (pale green), COP (darker purple), IDR (gray), and PHP (lighter purple).
Deliverable currency pairs made up the remaining $948 billion – up a more muted 12 percent YoY, which reflects different activity growth in their main driver: FX IM optimization, than in FX trading.
Estimating the Q1 2026 cleared fraction for NDFs, we have 6.63 / (9.36 x 2) = 35 percent, or about one third.
FX options
Moving onto FX options, cleared volumes break down as follows.
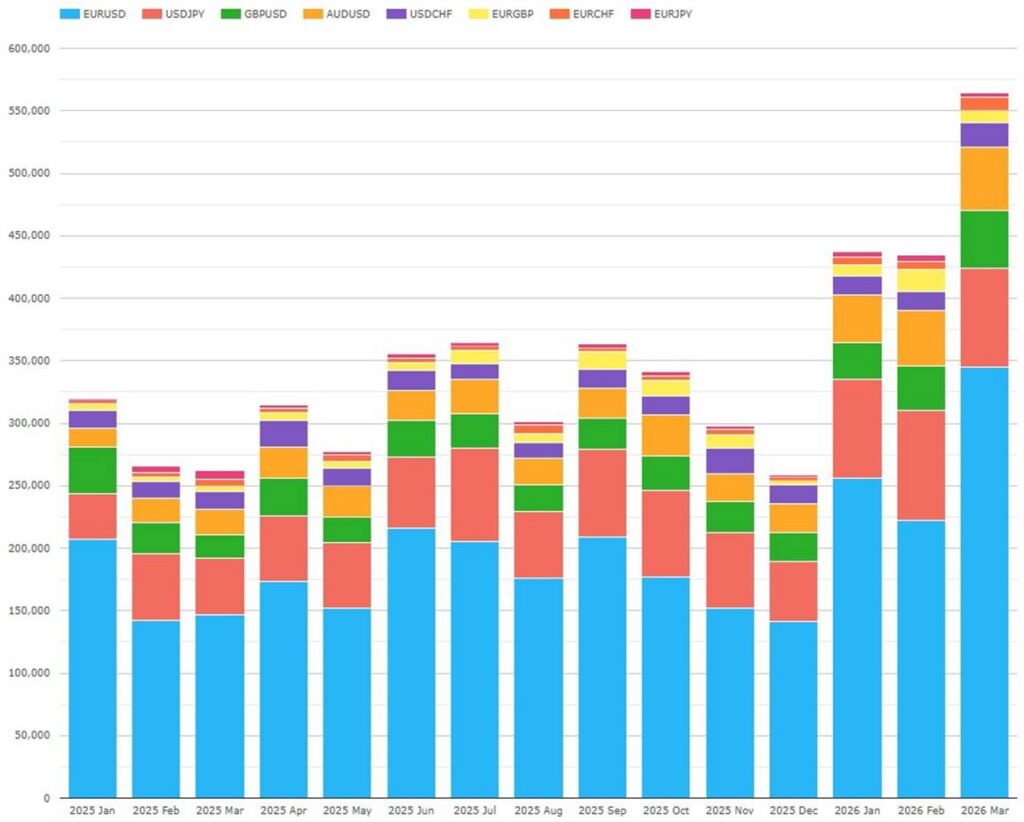
Chart 4: Cleared FX options (notional $ millions). Source: CCPView
Chart 4 breaks down by currency Chart 1’s record Q1 2026 FX options volumes of $1.44 trillion – up 70 percent YoY and up 60 percent QoQ. Trades versus USD were 95 percent of the volume Q1 2026 volume and broke down by currency as follows:
- EUR was by far the largest at $823 billion – up 66 percent YoY.
- JPY was next at $246 billion – up 82 percent YoY.
- AUD overtook GBP with $134 billion – up 142 percent YoY.
- GBP had $111 billion – up 39 percent YoY.
- CHF reported $48.7 billion – up 17 percent YoY.
Crosses versus EUR made up the remaining 5 percent and grew faster in total than the total of pairs versus USD:
- GBP was the largest at $36.3 billion – up 172 percent YoY.
- CHF was next at $23.2 billion – up 92 percent YoY.
- JPY made up the group with $13.6 billion – up 3.2 percent YoY.
All FX options were cleared at LCH ForexClear.
SDRView shows that total Q1 2026 vanilla FX options volumes were $7.11 trillion – flat YoY but up 38 percent QoQ. We chart the top 15 currency pairs below.
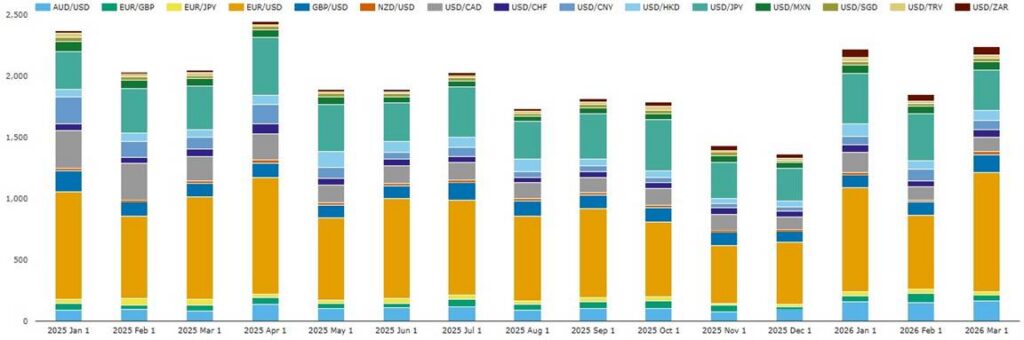
Chart 5: SDR-reported FX options on the top 15 currencies (notional US$ billions). Source: SDRView
Chart 5 shows that the top 15 pairs had similar volumes in Q1 2026 to those in Q1 2025, with a total of $6.31 trillion (89 percent of the total above the chart) – down 2.2 percent YoY but up 37 percent QoQ.
The 13 pairs traded versus USD made up $6.04 trillion, of which we highlight the major currencies plus HKD and CNY.
- EUR was the largest at $2.42 trillion – up 1.7 percent YoY.
- JPY was next at $1.13 trillion – up 10 percent YoY.
- AUD was next at $475 billion – up 79 percent YoY.
- GBP was next at $360 billion – down 10 percent YoY but up 14 percent QoQ.
- CAD was next at $393 billion – down 51 percent YoY but up 8.0 percent QoQ.
- HKD was next at $250 billion – up 28 percent YoY.
- CNY was next at $240 billion – down 46 percent YoY but up 107 percent QoQ.
Crosses against EUR (in GBP and JPY) make up the remaining volume of $268 billion – down 5.0 percent YoY, but up 35 percent QoQ.
Estimating the Q1 2026 cleared fraction for FX options, we have 1.44 / (6.31 x 2) = 11 percent, or about one ninth.
Cleared FX forwards
This quarter we also dig into cleared deliverable FX forwards volumes given the pronounced growth shown in Chart 1.
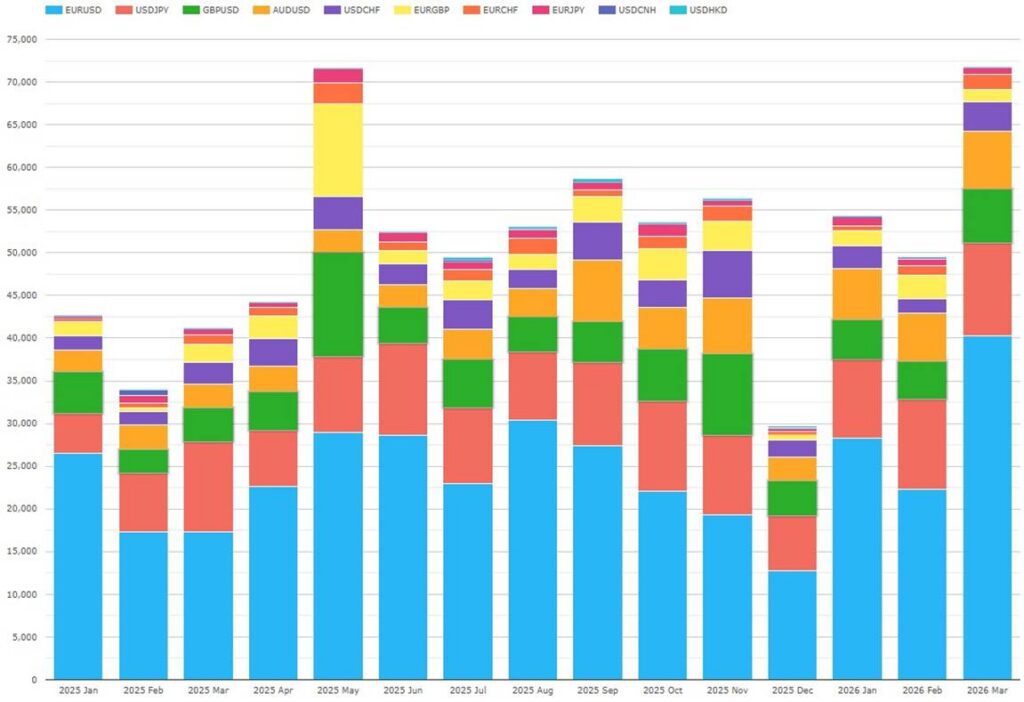
Chart 6: Cleared FX forwards (notional $ millions). Source:CCPView
Chart 6 breaks down by currency Chart 1’s record Q1 2026 FX forwards volumes of $175 billion – up 60 percent YoY and up 40 percent QoQ. March 2026 was a new peak month of $71.7 billion – just exceeding the prior peak of $71.5 billion set in May 2025.
Currencies traded versus USD were 93.2 percent of the volume.
- EUR was by far the largest at $90.8 billion – up 48 percent YoY.
- JPY saw $30.6 billion – up 39 percent YoY.
- AUD overtook GBP with $18.4 billion – up 124 percent YoY.
- GBP had $15.5 billion – up 33 percent YoY but down 22 percent QoQ.
- CHF traded $7.75 billion – up 33 percent YoY but down 27 percent QoQ.
- CNH executed $373 million – down 58 percent YoY but up 273 percent QoQ.
- HKD traded $34 million – down 62 percent YoY and down 94 percent QoQ.
- Currencies other than USD traded versus EUR were 6.8 percent of the volume.
- GBP had $5.92 billion – up 41 percent YoY but down 24 percent QoQ.
- CHF was $3.51 billion – up 78 percent YoY but down 2.9 percent QoQ.
- JPY saw $2.54 billion – up 44 percent YoY.
- CNH and HKD cleared 100% at HKEx while all other currencies cleared 100% at LCH ForexClear.
That’s it
We used six charts to cover FXD.
You can find a lot more data in CCPView, including:
- Analysis by date, week, month, quarter, or year.
- Volume metrics beyond new trade notional to trade count, average daily volume (ADV), open interest, and notional unwound/matured.
- More granular CRD volumes at index series or single-name level.
- FXD volumes for exchange-traded derivatives.
Contact us if you’re interested in a subscription.