This blog covers global notional volumes and CCP market shares of core cleared rates swaps in quarter one (Q1) 2026, including OIS and fixed-float IRS for all currencies and zero-coupon swaps for BRL and CLP only.
Key takeaways
In Q1 2026 global notional volumes of core cleared rates swaps were US$321 trillion – up 43 percent year-on-year (YoY) and up 18 percent quarter-on-quarter (QoQ). Percentage gains above 50 percent YoY in GBP, JPY, AUD, and about two thirds of the minor currencies. LCH continued to hold an above 95 percent market share of cleared swaps in all currencies except for EUR, JPY, CNY, INR, and four LatAm currencies.
- USD OIS (Fed Funds, SOFR) set a record of $81.4 trillion – up 34 percent YoY, but down 1.9 percent QoQ. CME had its highest ever share with 4.3 percent.
- EUR IRS (Euribor) and OIS (€STR) combined totaled €68.1 trillion (US$ 79.7 trillion) – down 3.1 percent YoY from the €70.3 trillion record set in Q1 2025, but up 35.3 percent QoQ. The YoY change comprised an increase in IRS and decrease in OIS. Eurex had 6.9 percent of EUR IRS and OIS combined – its highest share ever.
- GBP OIS (SONIA) set a record of £52.5 trillion (US$70.7 trillion) – up 87 percent YoY, and up 17 percent QoQ from the previous record of £45.0 trillion, which was set in Q4 2025.
- JPY OIS (TONA) had ¥4,669 trillion (US$29.4 trillion) – up 71 percent YoY, but down 0.61 percent QoQ from the previous record of ¥4,698 trillion, which was set in Q4 2025. LCH had 59.7 percent of Q1 TONA swaps – the first time it has led by more than 5 percent since Q3 2020.
- AUD IRS (BBSW) and OIS (AONIA) set a record of A$33.3 trillion (US$23.5 trillion) – up 68 percent YoY, and up 88 percent QoQ, and up 46 percent from the prior record A$22.8 trillion, which was set in Q1 2020.
- CAD OIS (CORRA) totaled C$11.3 trillion (US$8.17 trillion), a new record – up 41 percent YoY, and up 5.4 percent QoQ from the prior record of C$10.7 trillion, which was set in Q4 2025.
- EMEA currency IRS and OIS (except EUR and GBP) totaled US$9.77 trillion – up 52 percent YoY, and up 41 percent QoQ from the prior record of US$6.94 trillion, which was set in Q4 2025.
- AsiaPac minor currency IRS and OIS (except JPY and AUD) totaled US$13.0 trillion, a record quarter – up 57 percent YoY and up 14 percent QoQ from the prior record of US$11.5 trillion, which was set in Q4 2025. Shanghai Clearing House (SCH) has trended above 70 percent of CNY swaps with the help of Swap Connect. The Clearing Corporation of India Limited (CCIL) declined to 27.7 percent of INR swaps.
- LatAm currency IRS, OIS, and ZCS totaled US$5.41 trillion – up 61 percent YoY, and up 53 percent QoQ. This is a new record exceeding the previous record of US$4.53 trillion, which was set in Q2 2024. CME had an above 96 percent market share of all four LatAm currencies.
Read on for supporting charts, detailed stats, and CCP market shares.
USD OIS (Fed Funds or SOFR)
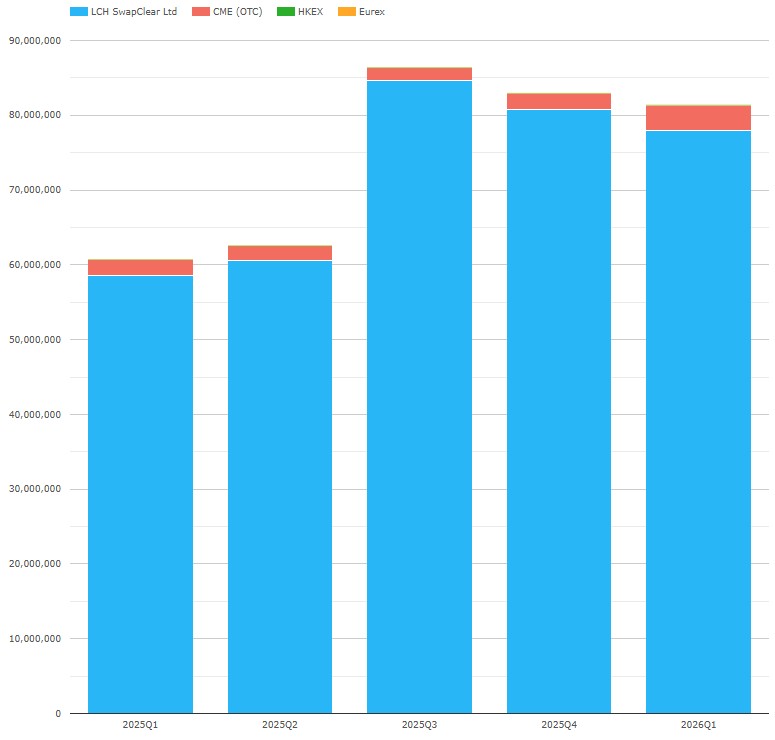
Chart 1: USD OIS volumes (single-sided gross notional $ millions). Source: CCPView
Chart 1 shows that, in Q1 2026, USD OIS totaled $81.4 trillion – up 34 percent YoY, but down 1.9 percent QoQ, and below the record $86.3 trillion set in Q3 2025.
- LCH SwapClear had $77.9 trillion – up 33 percent YoY, but down 3.6 percent YoY, and below its peak of $84.7 trillion set in Q3 2025.
- CME OTC had $3.46 trillion, its highest ever volume – up 63 percent YoY, and up 59 percent QoQ.
LCH continues to dominate USD OIS clearing while CME’s market share grew to 4.3 percent, its highest since Q1 2021 – up YoY from 3.5 percent and up QoQ from 2.6 percent.
EUR IRS (Euribor)
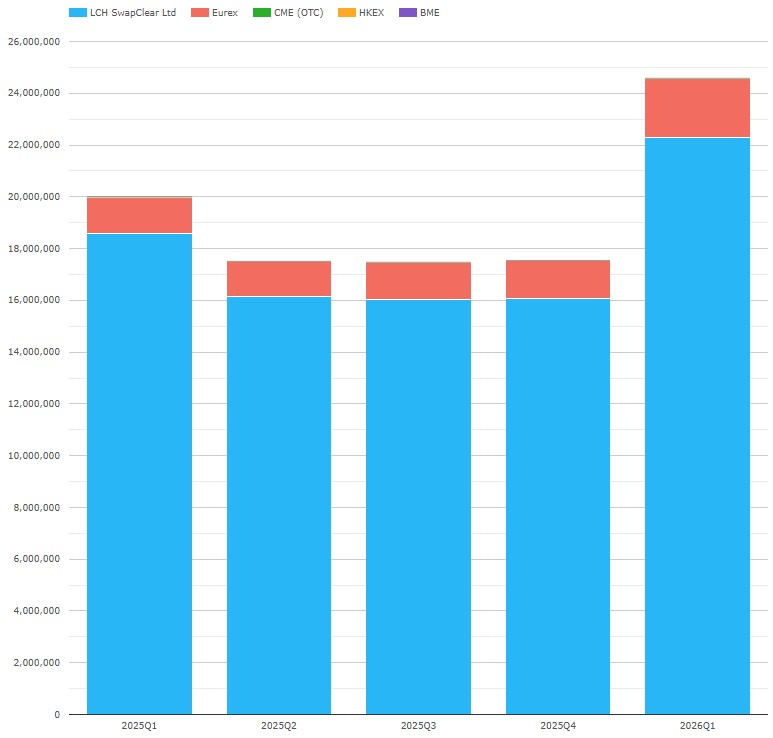
Chart 2: EUR fixed-float IRS single-sided gross notional in EUR millions. Source: CCPView.
Chart 2 shows that, in Q1 2026, EUR Euribor IRS totaled €24.6 trillion, its highest quarter ever – up 23 percent YoY from the prior record of 20.0 trillion set in Q1 2025, and up 40 percent QoQ.
- LCH SwapClear had €22.3 trillion – up 20 percent YoY, and up 39 percent QoQ.
- Eurex had €2.27 trillion – up 64 percent YoY, and up 53 percent QoQ.
LCH continues to lead Euribor swaps market shares, while Eurex market share reached 9.3 percent – up YoY from 6.9 percent, and up QoQ from 8.5 percent.
EUR OIS (€STR)
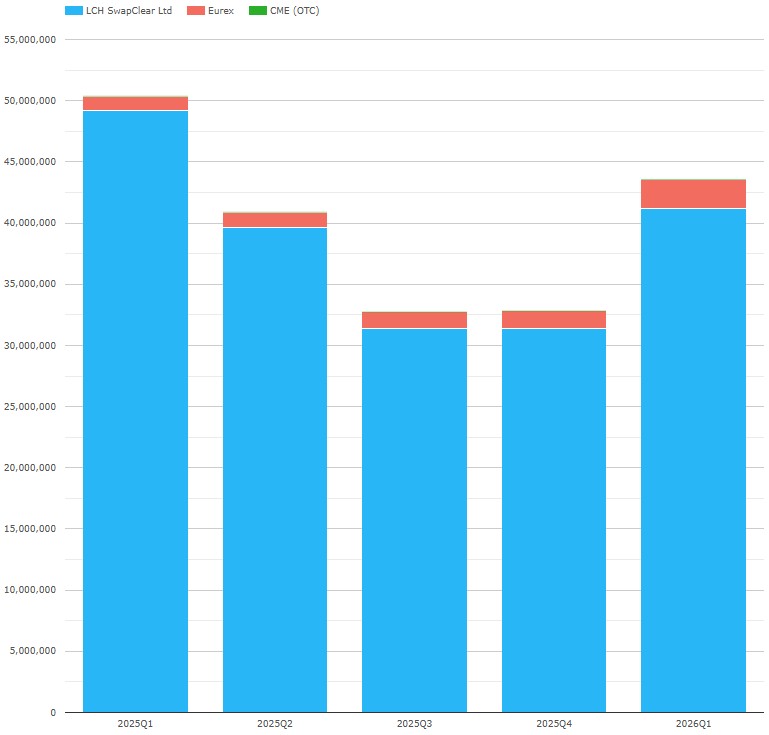
Chart 3: EUR OIS single-sided gross notional in EUR millions. Source: CCPView.
Chart 3 shows that, in Q1 2026, EUR €STR OIS totaled €43.6 trillion – down 13 percent YoY from its Q1 2025 record of €50.3 trillion, but up 33 percent QoQ.
- LCH SwapClear had €41.2 trillion – down 16 percent YoY, but up 31 percent QoQ.
- Eurex had € 2.40 trillion – up 115 percent YoY, and up 68 percent QoQ.
LCH continues to dominate EUR OIS, but Eurex increased its market share to 5.5 percent – up from 2.2 percent YoY, and up from 4.4 percent QoQ.
The combined Q1 2026 Euribor IRS and €STR OIS volumes were €68.1 trillion. At an FX rate of 1.17, this is equivalent to US$79.7 trillion, just below the USD OIS volume of US$81.4 trillion.
Eurex’s Q1 2026 share of Euribor and ESTR swaps combined was 6.9 percent – up from 3.6 percent YoY, and up from 5.8 percent QoQ. This was Eurex’s highest ever share – beating the previous peak of 6.7 percent, which was set in Q4 2020. This was likely achieved with the help of the ESMA Active Account Requirement (AAR), which went live at the end of Q2 2025.
GBP OIS (SONIA)
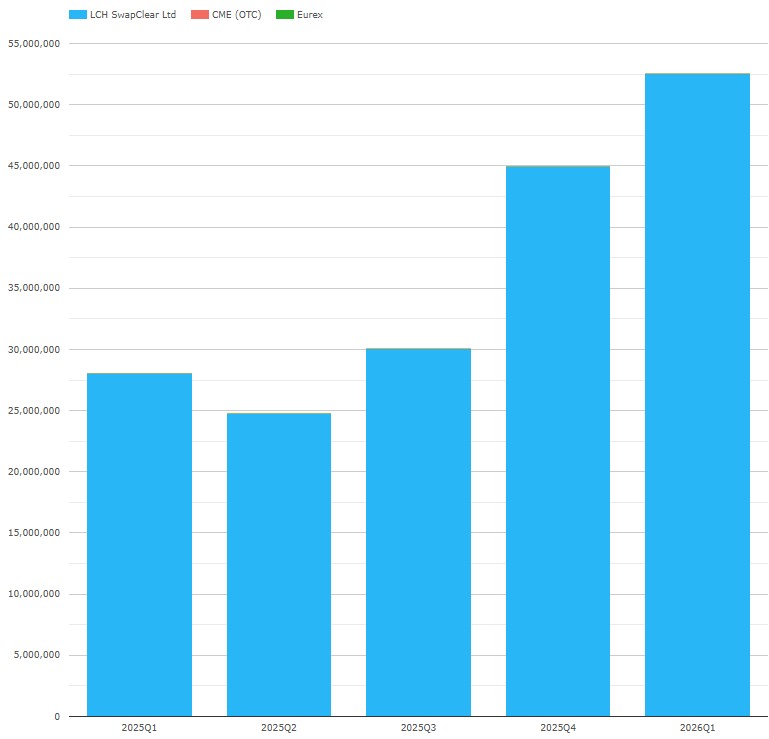
Chart 4: GBP OIS single-sided gross notional in GBP millions. Source: CCPView.
Chart 4 shows that, in Q1 2026, GBP SONIA OIS totaled £52.5 trillion, a new record – up 87 percent YoY, and up 17 percent QoQ from the previous record of £45.0 trillion set in Q1 2025.
LCH SwapClear had a 99.995 percent share.
At an FX rate of 1.345, the £52.5 trillion total is equivalent to US$70.7 trillion.
JPY OIS (TONA)
Here, we exclude the sustained small volume of JPY DTIBOR – about 0.3 percent of JPY swaps volume (ZTIBOR having stopped trading in 2024).
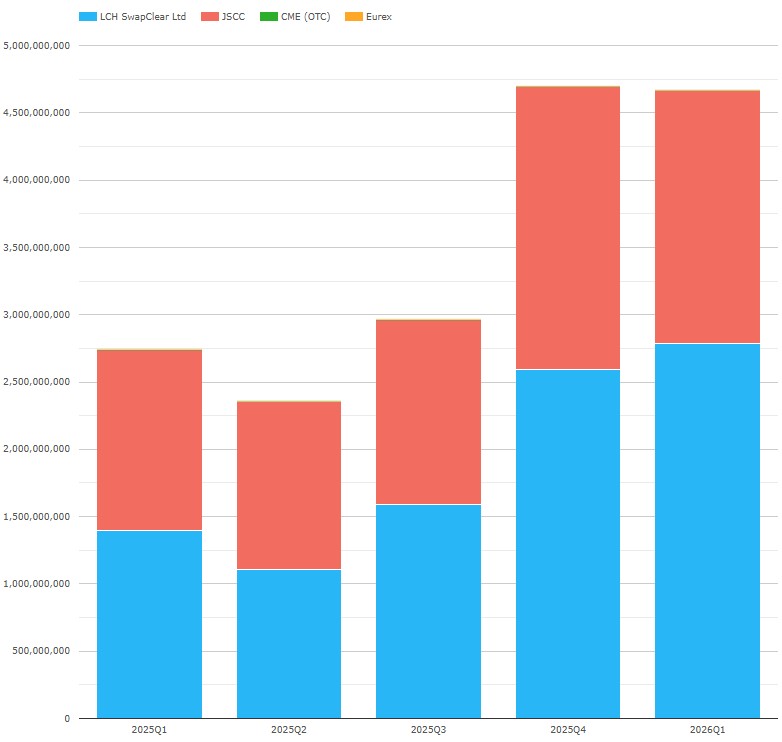
Chart 5: JPY OIS single-sided gross notional in JPY millions. Source: CCPView.
Chart 5 shows that, in Q1 2026, JPY TONA OIS totaled ¥4,669 trillion – up 71 percent YoY, but down 0.61 percent QoQ. Q1 was just shy of the record of ¥4,698 trillion set in Q4 2025.
- LCH SwapClear had ¥2,787 trillion – up 100 percent YoY, and up 7.4 percent QoQ. This was also a new high beating the previous high of ¥2,594 trillion set in Q4 2025.
- JSCC had ¥1,881 trillion – up 40 percent YoY, but down 10.5 percent QoQ from its previous high of ¥2,102 trillion set in Q4 2025.
At an FX rate of 159, the ¥4,669 trillion total is equivalent to US$29.4 trillion.
As JPY is arguably the most competitive swap currency between CCPs, it is worth including a chart of market share.
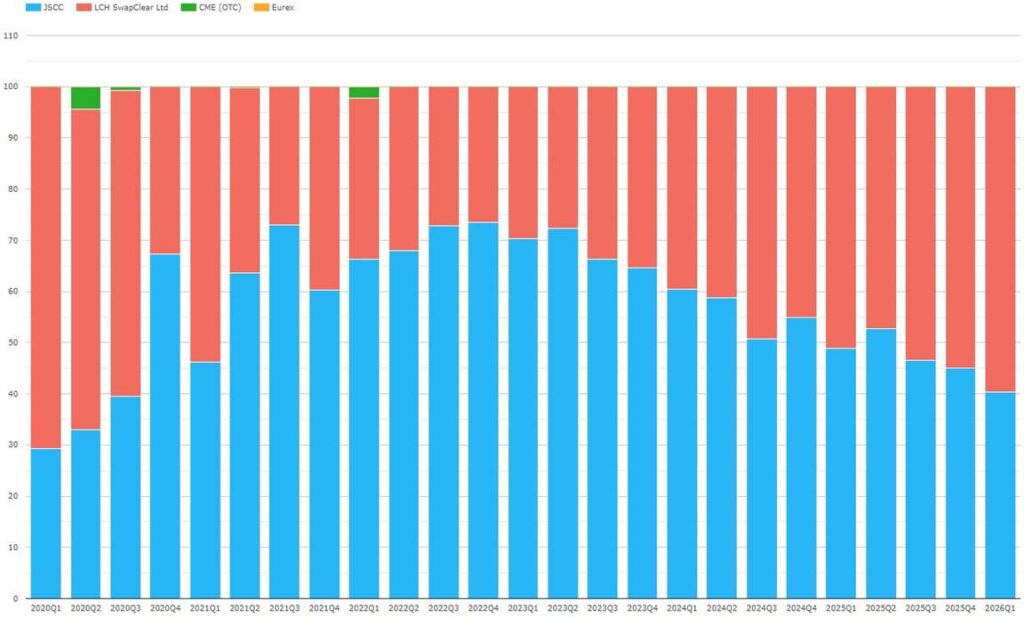
Chart 6: JPY OIS CCP notional share. Source: CCPView.
Chart 6 shows that, after a tussle in early 2025, LCH led JSCC with 59.7 percent of Q1 cleared TONA swaps – the first time it has had a lead of more than 5 percent since Q3 2020.
- LCH SwapClear took 59.7 percent in Q1 2026 – up YoY from 50.9 percent, and up QoQ from 55.2 percent.
- JSCC took 40.3 percent in Q1 2026 – down YoY from 49.1 percent, and down QoQ from 44.8 percent.
As noted in our recent blog, LCH has moved into its clearest lead since 2020. This was achieved with the benefit of the surge in offshore buy-side JPY swaps trading combined with US buy-side firms prohibited from clearing at JSCC before September 2025. After CFTC’s September 2025 approval for US funds to clear at JSCC plus some time for onboarding, we will soon see whether potentially tighter JPY swaps spreads in JSCC TONA swaps outweigh the cross-currency risk offsets in LCH’s IM model and entice US firms to shift clearing to JSCC.
AUD IRS (BBSW) or OIS (AONIA)
Chart 7: AUD IRS and OIS single-sided gross notional in AUD millions. Source: CCPView.
Chart 7 shows that, in Q1 2026, AUD IRS and OIS totaled A$33.3 trillion – up all of 68 percent YoY, and up 88 percent QoQ. This was a new record which exceeded the longstanding record of A$22.8 trillion (by 46 percent!) set in Q1 2020.
- LCH SwapClear had A$31.9 trillion – up 68 percent YoY, and up 92 percent QoQ.
- ASX had A$1.44 trillion – down 58 percent QoQ, and down 29 percent YoY.
CCP market shares were LCH 95.7 percent and ASX 4.3 percent, which was down from 4.6 percent YoY and down from 6.3 percent QoQ.
At an FX rate of 1.416, the A$33.3 trillion total is equivalent to US$23.5 trillion.
CAD OIS (CORRA)
CAD is limited to OIS (CORRA) after the last IRS (CDOR) trades cleared in Q3 2023.
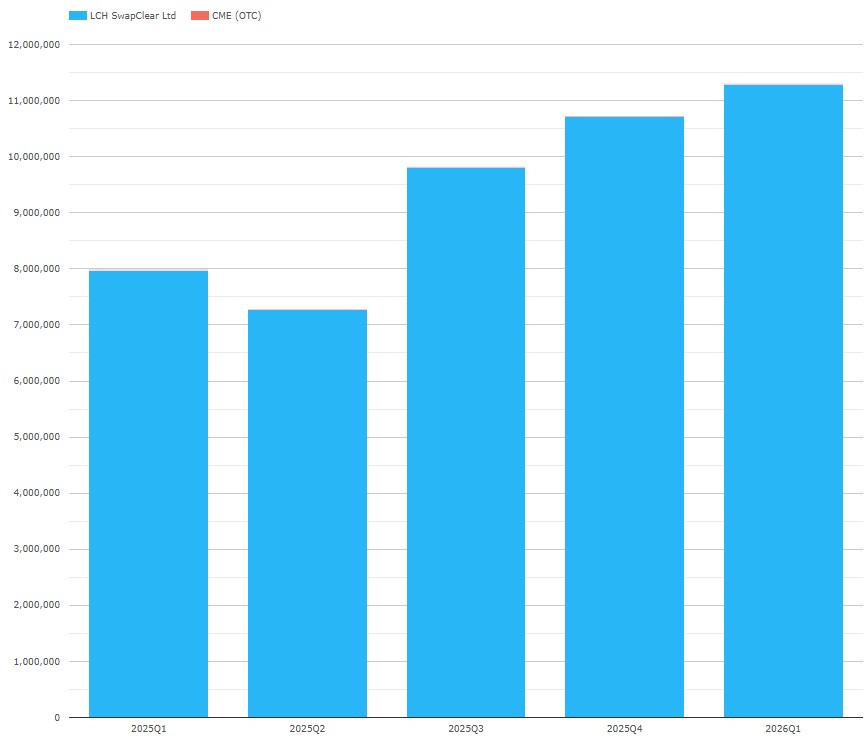
Chart 8: CAD IRS and OIS single-sided gross notional in CAD millions. Source: CCPView.
Chart 8 shows that, in Q1 2026, CAD CORRA OIS totaled C$11.3 trillion, a new record – up 41 percent YoY, and up 5.4 percent QoQ from the prior record of C$10.7 trillion set in Q4 2025.
LCH SwapClear had 99.97 percent of the volume.
At an FX rate of 1.383, the C$11.3 trillion total is equivalent to US$8.17 trillion.
EMEA IRS or OIS
Here we exclude EUR and GBP.
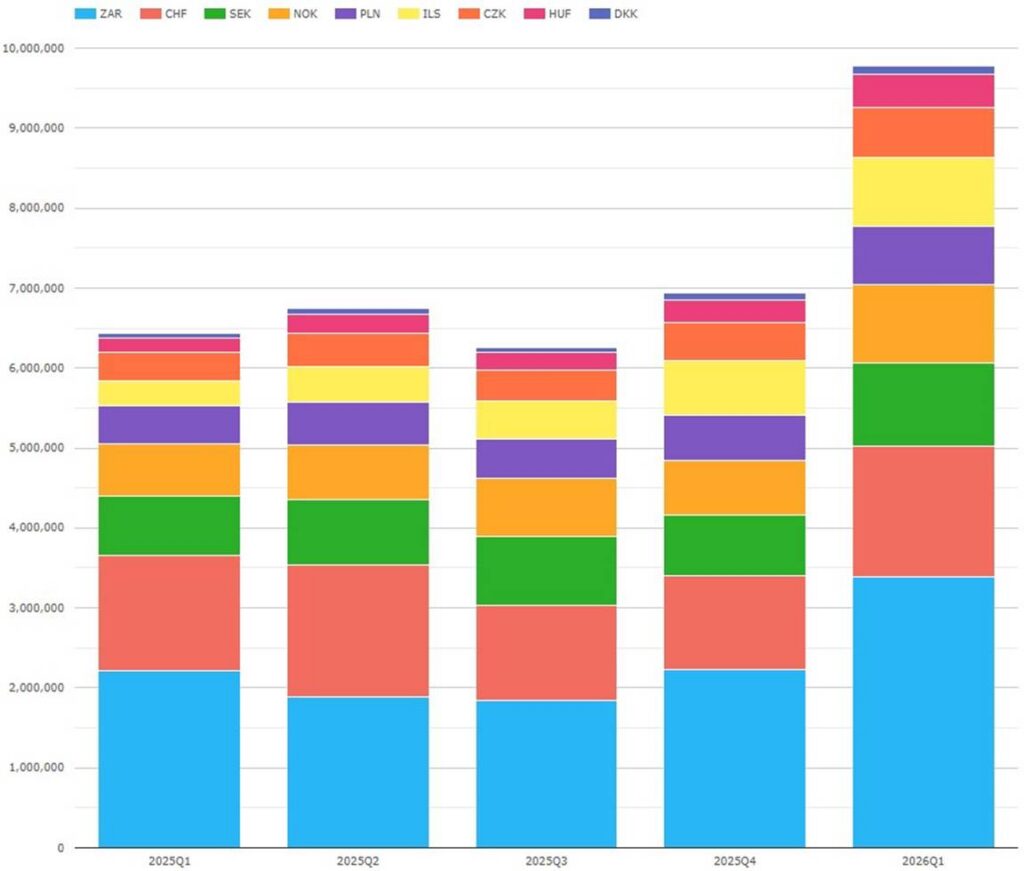
Chart 9: EMEA swaps single-sided gross notional in US$ millions. Source: CCPView.
Chart 9 shows that, in Q1 2026, EMEA currency IRS and OIS totaled US$9.77 trillion – up 52 percent YoY, and up 41 percent QoQ from the prior record of US$6.94 trillion set in Q4 2025. Volumes were up in all currencies from a year earlier.
- ZAR was the largest currency at US$3.39 trillion – up 53 percent YoY.
- CHF was next largest at US$1.63 trillion – up 14 percent YoY.
- SEK had US$1.05 trillion – up 40 percent YoY.
- NOK had US$972 billion – up 49 percent YoY.
- ILS overtook PLN with US$850 billion – up 175 percent YoY.
- PLN had US$737 billion – up 55 percent YoY.
- CZK had US$636 billion – up 77 percent YoY.
- HUF had US$410 billion – up 126 percent YoY.
- DKK had US$99.7 billion – up 72 percent YoY.
Q1 2026 saw LCH take a market share above 99.8 percent in each currency except for the following:
- CZK was split into LCH 98.66 percent and CME 1.34 percent – down YoY from 1.41 percent.
- PLN was split into LCH 97.63 percent and KDPW 1.26 percent – down YoY from 1.41 percent, CME 0.94 percent – down YoY from 0.99 percent, and Eurex 0.17 percent – up YoY from zero.
- HUF was split into LCH 97.75 percent and CME 2.25 percent – up YoY from 1.08 percent. HUF was the only EMEA minor currency where LCH lost more than 1 percent share.
AsiaPac IRS or OIS
Here we exclude JPY and AUD.
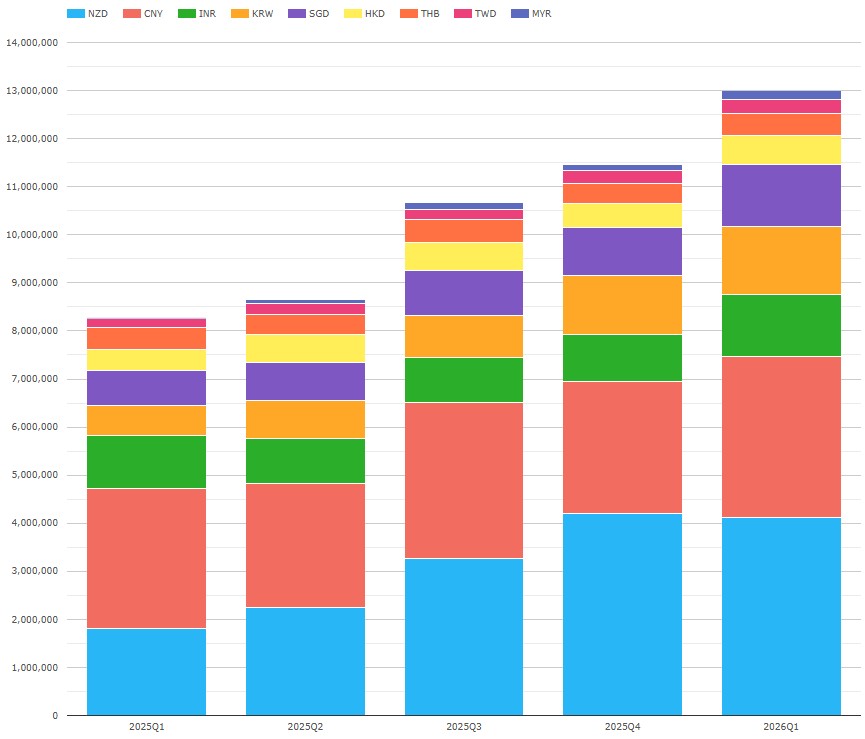
Chart 10: AsiaPac swaps single-sided gross notional in US$ millions. Source: CCPView.
Chart 10 shows that, in Q1 2026, AsiaPac currency IRS and OIS totaled US$13.0 trillion, a record quarter – up 57 percent YoY, and up 14 percent QoQ from the prior record of US$11.5 trillion set in Q4 2025. Volumes were up YoY in all currencies bar THB, including increases above 120 percent in NZD and KRW.
- NZD was the largest at US$4.12 trillion – up 129 percent YoY, but down 1.9 percent QoQ.
- CNY came next at US$3.35 trillion – up 15 percent YoY.
- KRW overtook INR and SGD for third place with US$1.41 trillion – up 124 percent YoY.
- SGD overtook INR for fourth with US$1.29 trillion – up 78 percent YoY.
- INR had US$1.28 trillion – up 16 percent YoY.
- HKD had US$601 billion – up 37 percent YoY.
- THB had US$458 billion – down 1.6 percent YoY, but up 10 percent QoQ.
- TWD had US$298 billion – up 64 percent YoY.
- MYR had US$195 billion – up 56 percent QoQ, after starting clearing in Q2 2025.
Calculating Q1 2026 market share by CCP, LCH had 100 percent in every currency except the following.
- CNY swap volumes were split into LCH 27.0 percent and SCH 73.0 percent – up YoY from 60.4 percent.
- INR swap volumes were split into LCH 72.3 percent and CCIL 27.7 percent – down YoY from 32.8 percent.
- HKD swap volumes were split into LCH 99.88 percent and HKEX 0.12 percent – down YoY from 0.32 percent.
LatAm IRS, OIS, or ZCS
Next, let us look at LatAm swaps by currency. For more information on BRL swaps, see our prior blog.
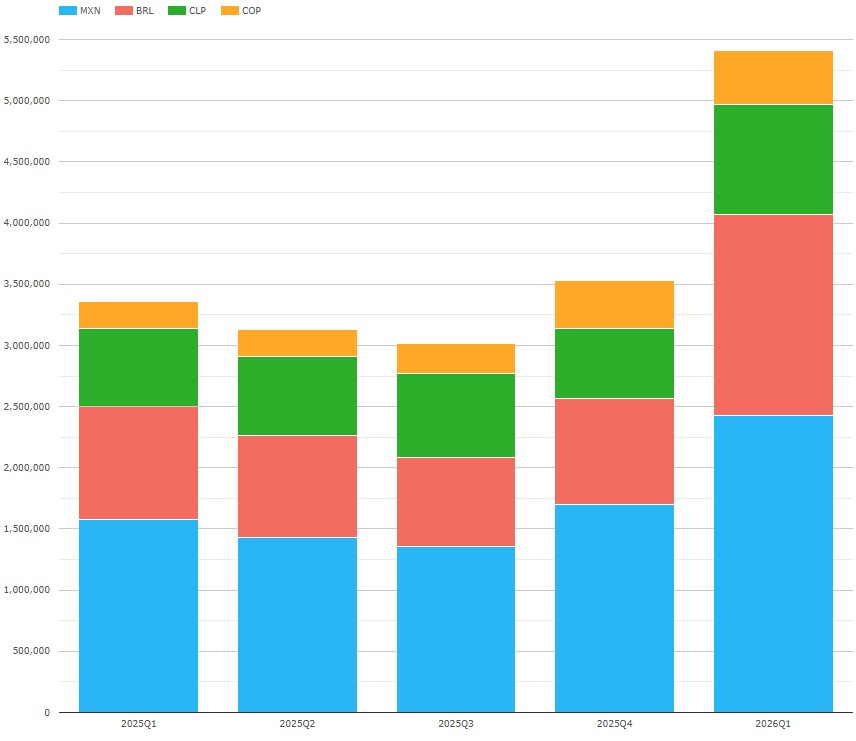
Chart 11: LatAm swaps single-sided gross notional in US$ millions. Source: CCPView.
Chart 11 shows that, in Q1 2026, LatAm swaps totaled US$5.41 trillion – up 61 percent YoY, and up 53 percent QoQ. This is a new record exceeding the previous record of US$4.53 trillion which was set in Q2 2024. Volumes were up YoY by at least 40 percent in each currency.
- MXN was the largest with US$2.42 trillion – up 53 percent YoY.
- BRL came next with US$1.65 trillion – up 79 percent YoY.
- CLP had US$895 billion – up 40 percent YoY.
- COP had US$445 billion – up 106 percent YoY.
Looking at Q1 2026 CCP market shares, CME had more than 96 percent of all four currencies.
- CME and Asigna/Mexder each gained over 0.33 percent of MXN at the expense of LCH.
- LCH’s share decreased in MXN to 2.4 percent, in CLP to 1.1 percent, and in COP to 2.7 percent, while increasing in BRL to 2.4 percent.
That’s it
The 11 charts included in this blog gave us a global overview of core cleared rate swaps by quarter, CCP, and currency.
The volumes in CCPView cover many more cleared instruments, metrics, and analysis parameters.
- Cleared instruments also include interest rate futures and options, other asset class futures and options, and cash US Treasuries.
- Volume metrics also include new trade count / DV01 / average daily volume (ADV), open interest (OI), OI change, and notional unwound/matured.
- Analysis parameters also include date / week / month / year, exchange, product subtype, tenor, and activity type (D2C or D2D trade).
For more details, please contact us for a CCPView demonstration.