At the end of March, clearing houses published their Q1 2026 CPMI-IOSCO Quantitative Disclosures. This blog focuses on cleared IM for rates swaps, credit derivatives (CRD) and exchange-traded derivatives (ETD) together with a sample of the other disclosures.
Key takeaways
31 March 2026 saw a new record in CCP-disclosed cleared IM for each of the three categories:
- Cleared rates swaps initial margin (IM) for nine selected CCPs was a record $372 billion on 31 March 2026 – up a modest 9.0% YoY, despite a 25% YoY increase in the big four CCPs’ OI.
- Cleared CRD IM was $82.0 billion – up 22% YoY, driven by increases at both ICE Clear Credit and LCH CDSClear, and roughly in line with the 15% YoY increase in aggregate CRD OI.
- ETD IM for ten selected CCPs was $697 billion – up 36% YoY, with the fastest growth coming from Eurex and JSCC.
- Beyond IM we cover major CCPs’ disclosure of kccp (4.2.1) – a reasonable proxy for total CCP risk. Aggregate kccp across major CCPs grew YoY by 26%, of which over half came from DTCC GSD.
IM for cleared rates swaps
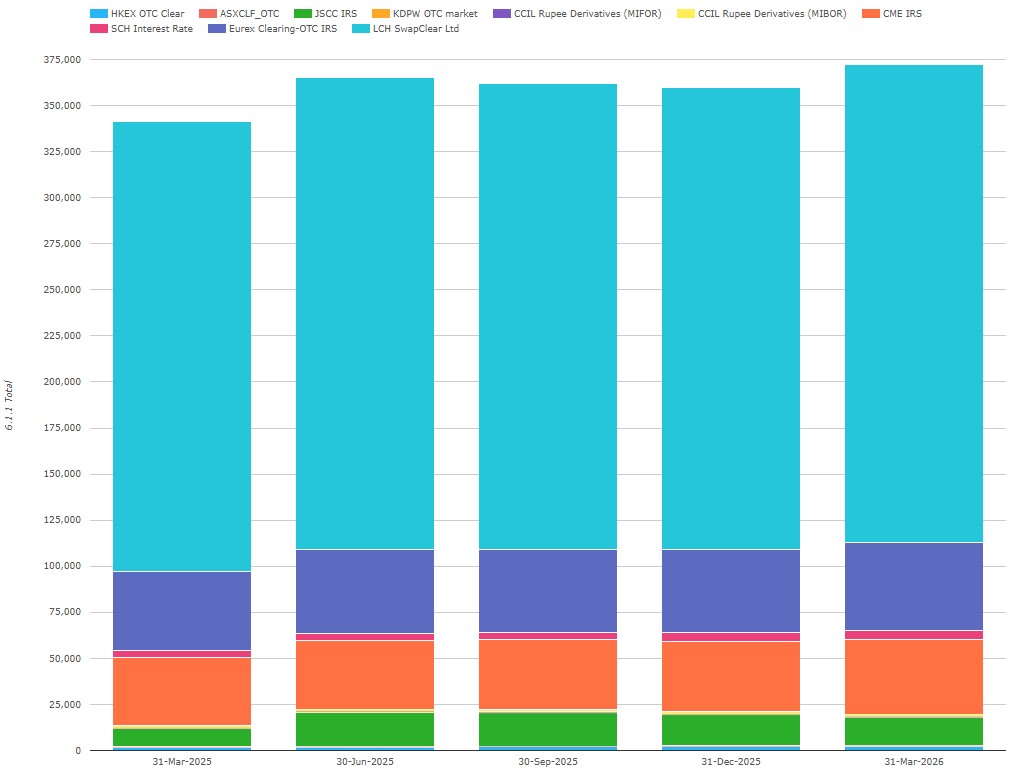
Chart 1: IRS IM by CCP ($ millions). Source: CCPView
Chart 1 includes cleared rates swaps IM from the four major CCPs (consistently 98% of total IM) along with the five most material other CCPs. The nine CCPs combined disclosed a record $372 billion on 31 March 2026 – up 9.0% YoY and up 1.9% from the end Q2 2025 high of $365 billion.
- LCH SwapClear reported a record $259 billion or £196 billion – in GBP terms, up 3.8% YoY and up 2.2% from the end Q4 2024 high of £192 billion (not shown).
- Eurex OTC IRS had $48.2 billion or €41.9 billion – in EUR terms, up 6.7% YoY but 29% below the end Q2 2022 high of €59.4 billion.
- CME IRS disclosed a record $40.4 billion – up 8.6% YoY and up 6.2% from the end Q3 2025 high of $38.1 billion.
- JSCC IRS revealed $15.1 billion or ¥2.41 trillion – in JPY terms, up 62% YoY but 10% below the end Q2 2025 high of ¥2,69 trillion.
The other CCPs were:
- Shanghai Clearing (from China) with $4.70 billion – up 25% YoY but 3.2% below the Q4 2025 high of $4.85 billion.
- HKEX OTCClear (from Hong Kong) with a record $2.27 billion – up 33% YoY and up 8% from the Q3 2025 high of $2.10 billion.
- CCIL (MIBOR and MIFOR combined, from India) with a record $1.69 billion – up 24% YoY and up 16% from the Q4 2025 high of $1.46 billion.
- ASX (from Australia) with $387 million – up 43% YoY but down 9.4% from the Q4 2025 high of $427 million.
- KDPW (from Poland) with a record $253 million – up 8.1% YoY and up 2.8% from the Q4 2025 high of $246 million.
For comparison, we show open interest (OI), also known as notional outstanding, for the big 4 CCPs over the same five quarters.
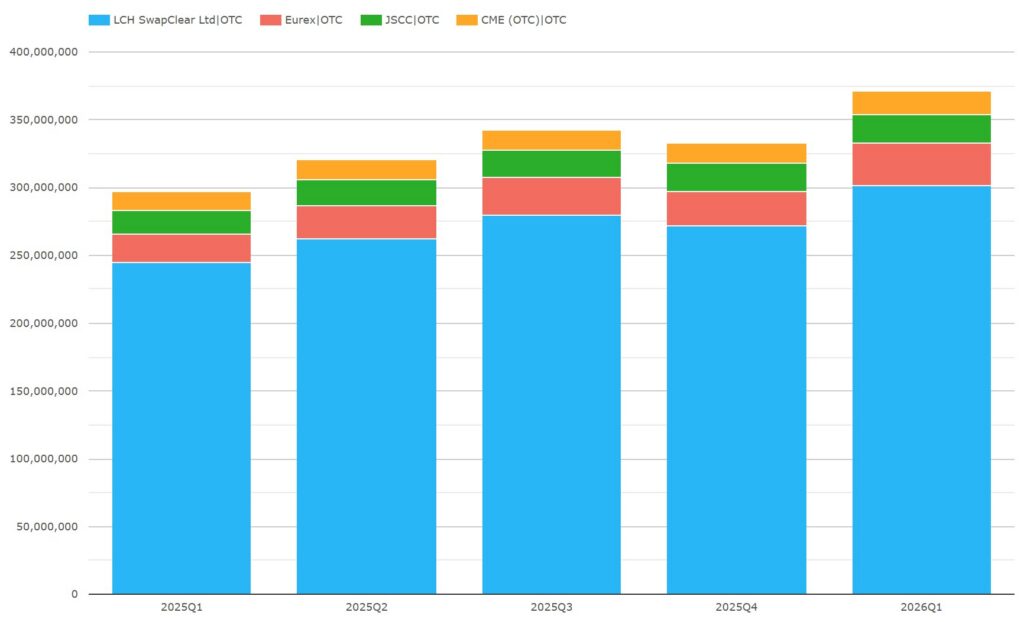
Chart 2: rates swaps OI by CCP ($ millions). Source: CCPView
Chart 2 shows that rates swaps OI for the big four CCPs totaled a record $371 trillion on 31 March 2026 – up 25% YoY and up 8.3% from the Q3 2025 high of $343 trillion. All four CCPs set new record quarter-end OI levels:
- SwapClear OI was $301 trillion – up 23% YoY.
- Eurex OI was next with $31.1 trillion – up 53% YoY.
- JSCC OI was $21.6 trillion – up 20% YoY.
- CME OI was $17.0 trillion – up 22% YoY.
Eurex’s OI comfortably outgrew those of the other CCPs, perhaps because of the Active Account Requirements (AAR) which went live in Q2 2025. This caused dealers, especially, to shift some EUR swaps volume to Eurex from other CCPs. The limited YoY IM growth of 3.8% at SwapClear and 6.7% at Eurex suggests this shift was made in a margin efficient manner.
IM for cleared CRD
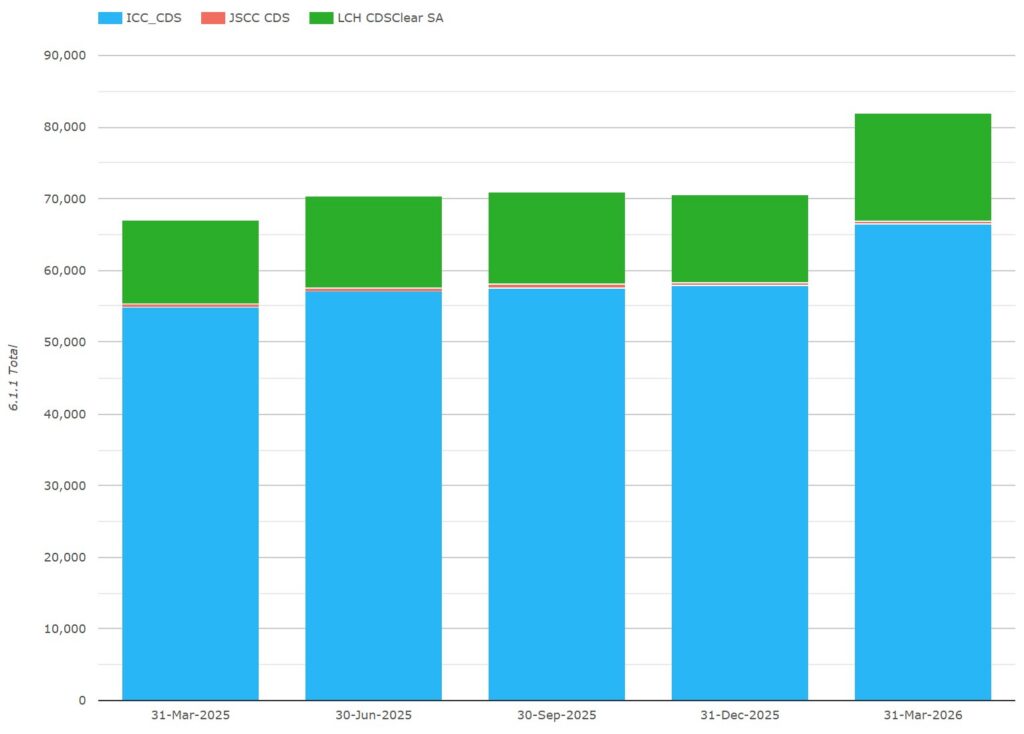
Chart 3: CRD IM by CCP ($ millions). Source: CCPView
Chart 3 illustrates that IM at major CRD CCPs was a record $82.0 billion on 31 March 2026 – up 22% YoY exceeding its long-standing peak of $77.0 billion set back in Q2 2022 (not shown).
- ICE Clear Credit disclosed a record $66.4 billion – up 21% YoY and up 13% from the end Q2 2025 high of $58.8 trillion.
- LCH CDSClear reported $15.3 billion or €13.3 billion – in EUR terms up 22% YoY and up 20% from the end Q2 2025 high of €11.1 billion.
- JSCC CDS reported $395 million or ¥63.0 billion – in JPY terms flat YoY and well below its end Q1 2020 peak of ¥184 billion (not shown).
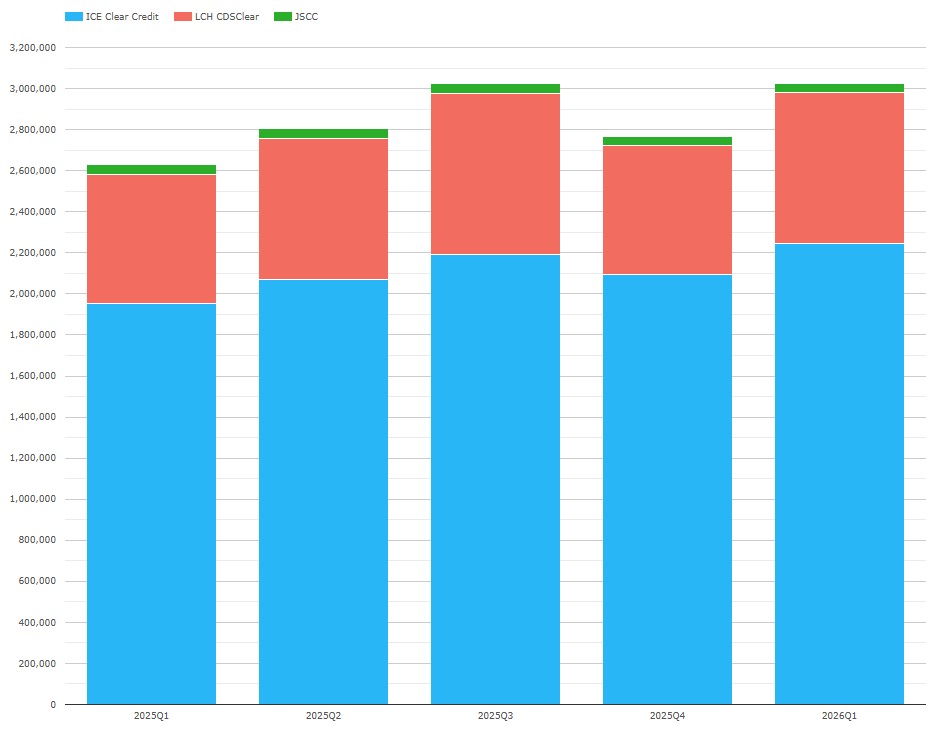
Chart 4: CRD OI by CCP ($ millions). Source: CCPView
Chart 4 shows that CRD OI (open interest or notional outstanding) was a record $3.03 trillion – up 15% YoY and a hair above the end Q3 2025 high of $3.02 trillion.
While the Q1 2026 YoY increases of IM and OI were roughly in line, the half-on-half (HoH) increase in Q1 2026 IM from Q3 2025 was not matched by a HoH increase in OI as the increase in ICE OI was largely offset by a decline in LCH OI. Drilling down by product type (not shown) tells me that LCH CDX OI declined while LCH single-name CDS increased. Perhaps this is a hint on the LCH IM increase despite its OI decline.
IM for ETD (all asset classes)
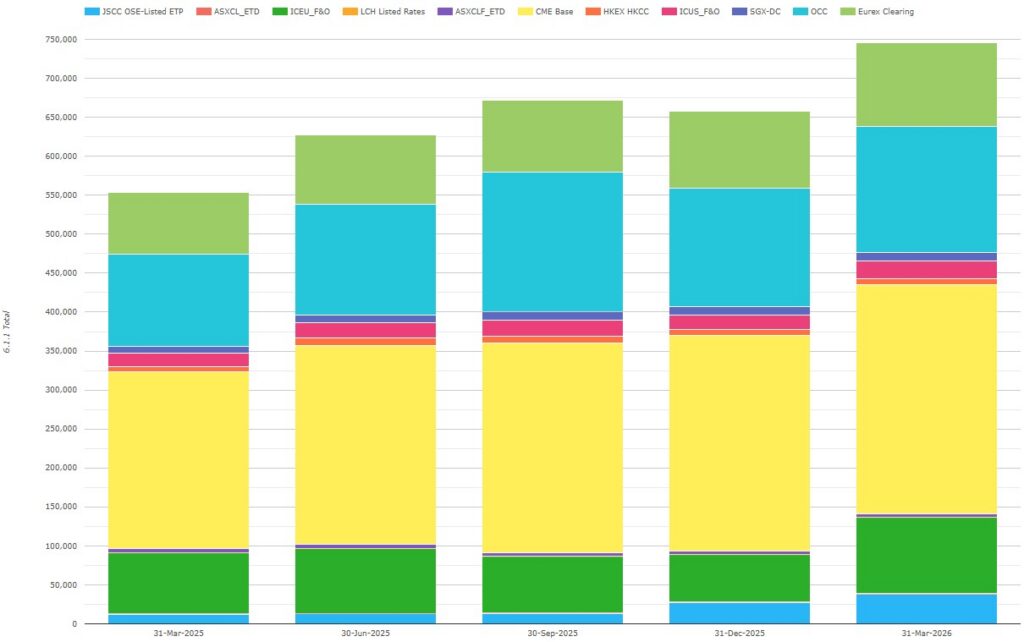
Chart 5: ETD IM by CCP ($ millions). Source: CCPView
Note: Chart 5 figures include Eurex OTC IRS IM, which I excluded from the following figures.
IM at our ten selected ETD CCPs was a record $697 billion on 31 March 2026 – up 36% YoY and up 11% from the end Q3 2025 high of $627 billion.
- CME disclosed $294 billion – up 30% YoY and up 6.1% from the end Q4 2025 high of $277 billion.
- OCC had $162 billion – up 37% YoY but down 10% from the end Q3 2025 high of $180 billion.
- ICE Europe F&O declared $97.9 billion – up 25% YoY and up 17% from the end Q2 2025 high of $83/7 billion.
- Eurex divulged $59.0 billion – up 59% YoY and up 10.3% from the end Q4 2025 high of $53.5 billion.
- ICE US F&O showed $23.0 billion – up 32% YoY and up 11% from the end Q3 2025 high of $20.8 billion.
- JSCC OSE Listed ETP reported $37.9 billion – up all of 206% YoY and up 38% from the end Q4 2025 high of $27.5 billion.
- SGX-DC had $10.9 billion – up 27% YoY and up 4.2% from the end Q4 2025 high of $10.4 billion.
- HKEX HKCC declared $7.53 billion – up 3% YoY but 19% below the end Q2 2025 high of $9.3 billion.
- ASX CLF ETD and ASX CL ETD combined divulged $5.18 billion – down 9.0% YoY and 16% below the end Q2 2025 high of $6.17 billion.
- LCH Listed Rates reported IM of $70 million – up 17.5x YoY and up 25% from the end Q4 2025 high of $56 million.
For comparison, we look at the corresponding quarterly rates ETD notional volumes, in table form for visibility of the smaller players.
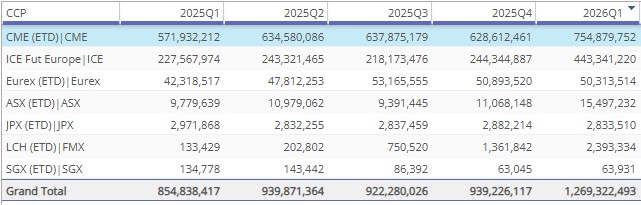
Table 1: rates ETD notional volumes by CCP ($ millions). Source: CCPView
Table 1 shows the volumes dynamic at seven of the CCPs in Chart 3 was somewhat aligned with the dynamic in their quarter end IM.
Other disclosures – kccp
Those of you with CCPView access can use the Disclosures tab to review any combination of a subset of the 44 CCPs a subset of the 200 numeric and non-numeric disclosures. You might configure the highlighting to isolate the larger quarter-on-quarter (QoQ) changes in the numeric disclosures. You might also use the charting to plot trends in one disclosure over time. We also offer an API to access the data programmatically.
Beyond IM, rather than “boiling the ocean” of over 200 other facts about 44 CCPs, going forward I will pick an interesting non-IM disclosure each quarter. Today the topic will be the kccp (disclosure 4.2.1) of major CCPs.
kccp is required by bank regulators to be calculated by CCPs so that clearing members can calculate their CCP facing counterparty credit risk weighted assets (ccRWA). In addition, it can be thought of as a proxy for the total counterparty credit risk faced by each CCP.
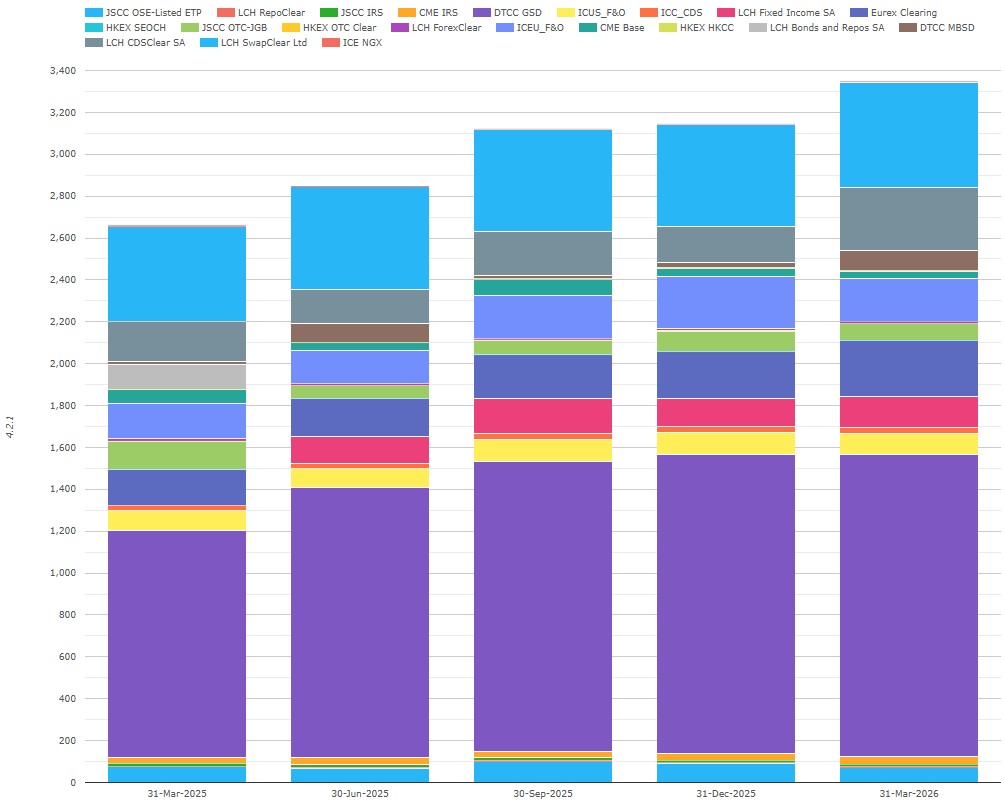
Chart 6: kccp by major CCP ($ millions). Source: CCPView
Chart 6 illustrates that the total kccp across major CCPs was 3,349 – up by 687 (26%) YoY. Over half of the increase came from DTCC GSD – up YoY by 363 (+34%) to 1,445, perhaps driven by the expansion of Treasury clearing ahead of the Q2 2027 completion of the SEC mandate. The only other CCPs which increased by more than 50 were:
- LCH CDSClear – up YoY by 111 (+58%) to 303.
- Eurex Clearing – up YoY by 96 (+56%).
- DTCC MBSD – up YoY by 78 (+458%) to 95.
- LCH SwapClear Ltd – up YoY by 52 (+12%) to 503.
- Comparing risk metrics across CCPs for repo, rates swaps, credit swaps and ETD is invidious given very different risk components and default resource structures. What we know is that US Treasury repo is by far the largest cleared government bond repo market and that DTCC GSD is also the only repo CCP in the world with material buy-side repo clearing.
- One other point which leapt from the chart: I was surprised that the kccp for CME Base was 34 while ICE EU F&O was 206 and ICE US F&O was 97. These facts seem inconsistent with the fact that CME OI is about 2.5x the OI of the two ICE CCPs combined. Answers on a postcard please.
Next quarter, my suggested topic for this section is profits (15.2.3) at major CCPs. If you have access to CCPView, feel free to explore that or other disclosures in the meantime.
End note
Flip back to the start of the blog to recap the takeaways.
CCPView disclosures tab has quarterly disclosures data from 30 September 2015 to 31 March 2026 for 44 clearinghouses, each with multiple clearing services, covering equities, bonds, futures, options, and OTC derivatives – with over 200 quantitative data fields with supporting notes.
If you are interested in using CCPView, get in touch.