This blog looks at Q1 2026 volumes of US-reported compression of cleared “core” rate swaps (meaning OIS, fixed float IRS, and basis swaps).
Key takeaways
- Q1 2026 saw cleared core swap compression volumes of $56 trillion ($49.7 trillion OIS, $5.6 trillion IRS, and $0.5 trillion basis swaps) – up 43% year-on-year (YoY).
- D2C SEFs (TradeWeb and Bloomberg) took 2.4% compression market share from off-platform and 0.6% from D2D SEFs.
Scope and background
This blog continues our coverage of US-reported rates swap compression volumes after 2025 SDR-reported IR compression and before that H1 2025 SDR-reported IR compression and 2024 US SDR-Reported IR Compression. As it was for the first blog linked above, our scope here is US-reported compression of cleared “core” rates swaps (again: OIS, fixed float IRS, and basis swaps).
For context, we show all Q1 2026 core rates swaps activity by package type below.
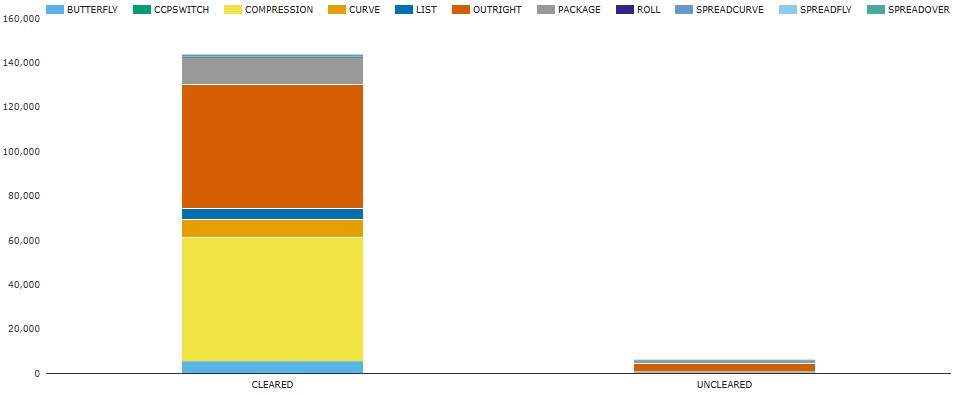
Chart 1: Q1 2026 US-reported core rate swap volumes by cleared versus uncleared and by package type (notional USD billions). Source: SDRView
Chart 1 shows the total of $150 trillion in Q1 2026 of cleared and uncleared core rates swaps broken down by package type.
- Cleared compression was $56 trillion or 37% of the total.
- Uncleared compression was barely visible in the chart at $490 billion or 0.3% of the total and is not covered below.
As context, we have also excluded US-reported compression of the following products:
- FRAs – which were dominated by activity in reset optimization and covered by the blogs Reset optimization: part 1 – FRA activity and Reset optimization: part 2 – SPS activity.
- Swaptions – which were dominated by activity in rates IM optimization and covered by the blogs Rates IM optimization and Rates IM optimization and swaption terminations.
- Inflation swaps – which were only 1% of that product’s trading volumes.
- Cross-currency swaps – which were only 0.1% of that product’s trading volumes.
We also exclude multilateral vendor compression (which are reported to APAs by the vendors instead of to SDRs by the participants) and CCP blending and netting (which are reported in summary on CCP websites and not to SDRs by participants).
I will tend to avoid duplication of the prior blogs, so as you open one or more you might want to keep them open for further reference as you read.
Cleared OIS compression
We look at month-by-month volumes by currency.
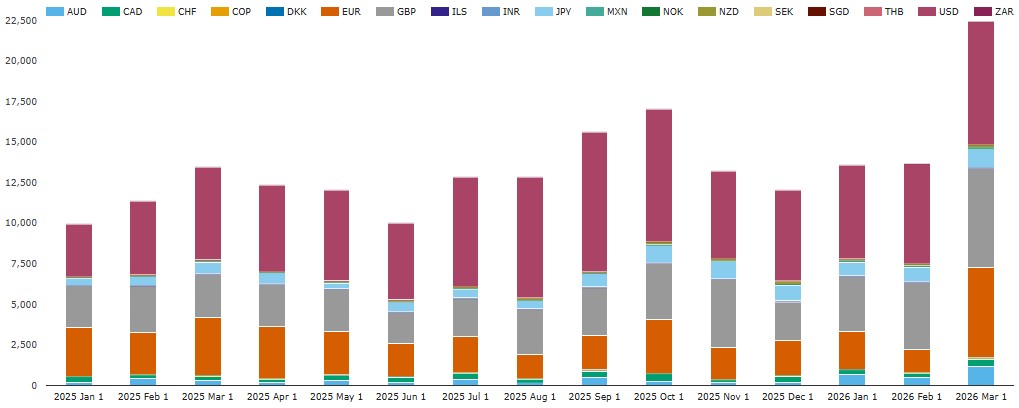
Chart 2: US-reported cleared OIS compression volumes by currency (notional USD billions). Source: SDRView
Note that we removed OIS in BRL, CLP, and KRW from the chart as OIS would only be reported for these currencies because of reporting anomalies.
Chart 2 shows the month-by-month currency breakdown of US-reported cleared OIS compression volumes. March was the highest month ever with $22.4 trillion exceeding the previous high month of $17.0 trillion set in October 2026.
Aggregating by quarter, Q1 2026 saw $49.7 trillion – up 43% YoY from $34.7 trillion in Q1 2025. Of the Q1 2026 total, the top eight currencies were 99.1%.
- USD was the largest with $19.4 trillion – up 45% YoY.
- GBP was next with $13.6 trillion – up 68% YoY.
- EUR had $9.35 trillion – up 2.2% YoY.
- JPY had $2.78 trillion – up 65% YoY.
- AUD had $2.36 trillion – up 163% YoY.
- CAD had $954 billion – up 12.4% YoY.
- MXN had $371 billion – up 113% YoY.
- NZD had $339 billion – up 289% YoY.
Of the above, compression in AUD and MXN far outgrew aggregate volumes in risk-trading package types in the respective currency. In both cases, D2C SEF compression drove the growth (visible to SDRView subscribers), suggesting newly increased focus on portfolio clean up in those two currencies by large hedge funds.
Cleared fixed float IRS compression
We look at month-by-month volumes by currency.
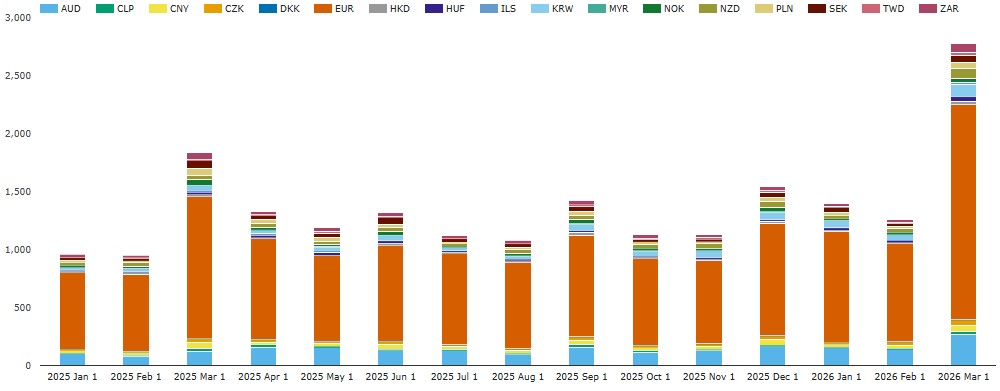
Chart 3: US-reported cleared fixed float IRS compression volumes by currency (notional USD billions). Source: SDRView
Chart 3 shows the month-by-month currency breakdown of the “real” cleared fixed float IRS compression volumes. By “real” I mean that we excluded reporting anomalies in currencies which have transitioned off IBORs which can therefore no longer be cleared at LCH SwapClear (USD, GBP, JPY, CAD, CHF, SGD, THB, MXN, INR, COP) which totaled $167 billion in March 2026 (of which 87% was USD, GBP, and JPY). March 2026 saw $2.82 trillion, which was comfortably the highest month ever, exceeding the previous high in March 2025 of $17.0 trillion, and even the volumes including the currencies above in every month before LIBOR transition (not shown).
Aggregating by quarter, Q1 2026 saw $5.60 trillion of cleared IRS compression volume – up 43% YoY from $3.91 trillion in Q1 2025. Of the Q1 2026 total, the top eight currencies were 92.7%.
- EUR had $3.69 trillion – up 45% YoY (much faster growth than EUR OIS).
- AUD had $552 billion – up 73% YoY (much slower growth than AUD OIS).
- ZAR was the leading non-major currency with $271 billion – up 7.9% YoY.
- KRW had $209 billion – up 143% YoY.
- NZD had $142 billion – up 49% YoY.
- SEK had $131 billion – up 20% YoY (reflecting the shift to OIS in that currency).
- CZK had $102 billion – up 64% YoY.
- CNY had $98 billion – up 6.3% YoY.
Of the currencies which grew by a higher percentage than EUR, AUD (as for OIS), KRW, and NZD were powered by D2C SEF compression growth, while KRW was powered by off-platform compression growth (visible to SDRView subscribers).
Cleared basis swap compression
We look at month-by-month volumes by currency.
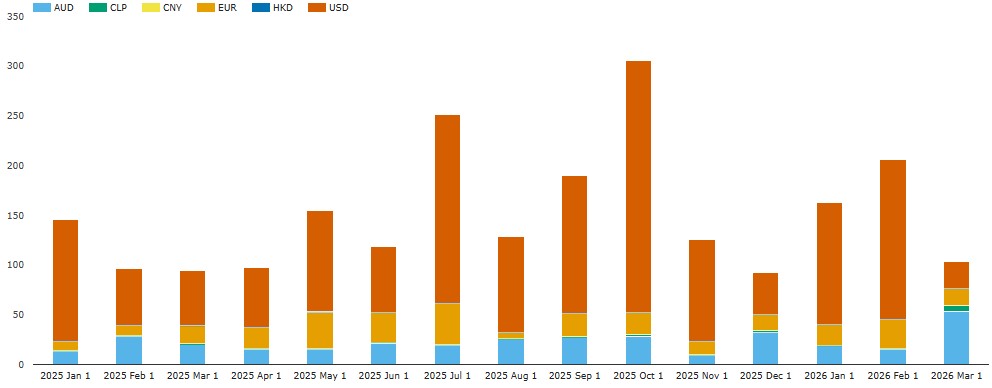
Chart 4: US-reported cleared basis swap compression volumes by currency (USD billions). Source: SDRView
Chart 4 shows the month-by-month currency breakdown of cleared basis swap compression volumes. Aggregating by quarter, Q1 2026 saw $472 billion of cleared basis swap compression volume – up 40% YoY from $337 billion in Q1 2025. Only three currencies had material volume (the interest bases can be analyzed by SDRView subscribers).
- USD FedFunds versus SOFR swaps had $310 billion – up 32% YoY.
- AUD BBSW versus AONIA swaps or BBSW payment frequency swaps had $87.1 billion – up 43% YoY.
- EUR Euribor versus EONIA swaps or Euribor payment frequency swaps had $67.6 billion – up 79% YoY.
You may be surprised that EUR basis swap volumes were lower in volume than those in AUD. This reflects the long-standing EUR swap market practice of trading index basis via a matched opposing pair of OIS (EONIA) and IRS (Euribor) which are absent from basis swap volumes and would appear in the volumes in the prior sections. EUR basis swaps only became more frequently traded in 2022 (visible to SDRView subscribers), perhaps due to increased bank concerns about the GSIB notional inefficiency of trading two trades instead of one.
Platform volumes and share
For portfolio clean-up it is well-known that buy-side firms clearly focus on D2C SEF compression while they are presumably a minority of bilateral off-platform compression and a tiny fraction of the dealer dominated CCP and vendor compression volumes (not reported to SDRs). By contrast dealer banks focus on CCP and vendor compression (not reported to SDRs) as well as supplementing with bilateral off-platform compression included here. It may help to note that D2C SEF compressions are really portfolio transfers, that is, every $1 of D2C SEF compression results in $1 less of buy-side cleared notional and $1 more of dealer cleared notional. This is one reason CCP and vendor compression are much larger in volume (not shown here) than US-reported compression.
We look at month-by-month volumes by platform.
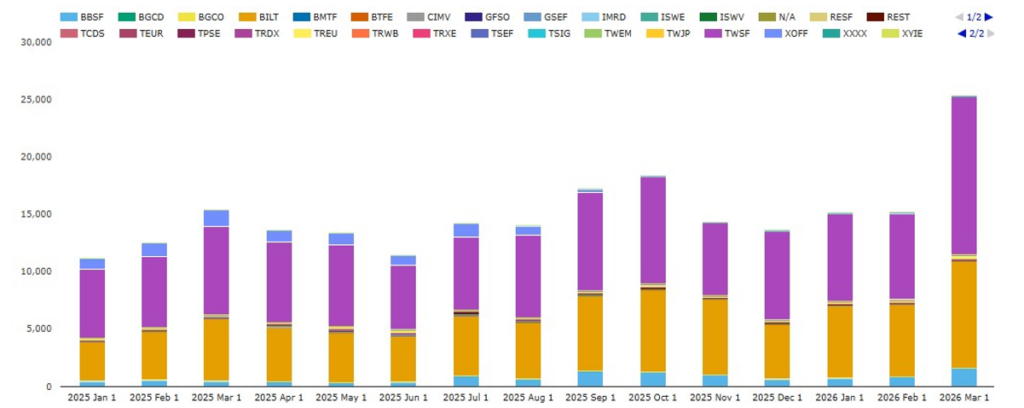
Chart 5: Platform shares of US-reported cleared core rate swap compression volumes (percentage of USD notional). Source: SDRView
Chart 5 illustrates month-by-month core rates swap compression volumes by platform. Aggregating by quarter yields Q1 2026 and Q1 2025 volumes:
- Tradeweb group (led by TWSF) was the main D2C SEF compression platform group in Q1 2026 with $29.8 trillion – up YoY by 45%.
- Bloomberg group (led by BBSF) was the only other D2C SEF compression platform group with $3.17 trillion – up YoY by 120%.
- Off-platform compression (led by BILT) had $22.4 trillion – up YoY by 35%. We can see that platform id XOFF (“off-platform trades in listed instruments”) has all but disappeared as banks corrected their reporting to use platform id BILT (“bilateral”).
- D2D compression platform groups (OSTTRA Reset, BGC, TP, Tradition, and ICAP) combined for a total of $568 billion – down YoY by 12%.
To summarize, D2C SEF compression platforms comfortably outgrew off-platform bilateral compression, while D2D SEF compression declined in volume.
Recharting the same data as market shares gives the following chart.
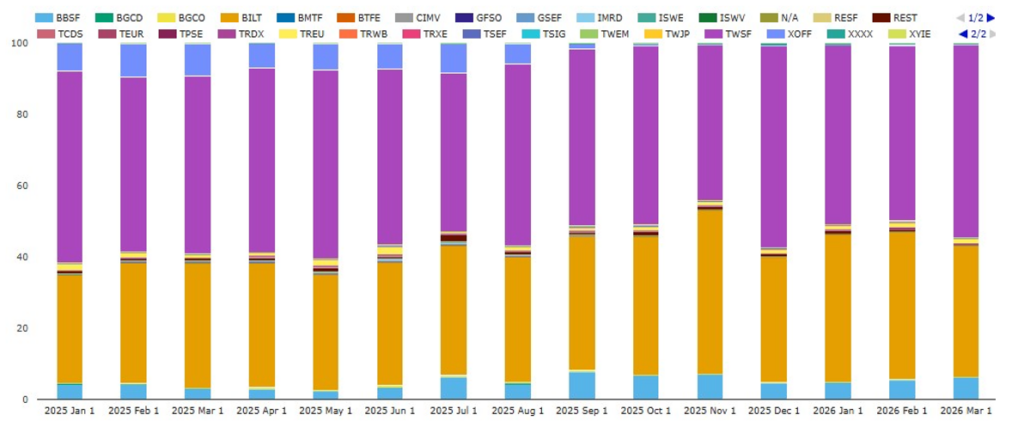
Chart 6: Platform shares of US-reported cleared core rate swap compression volumes (percentage of USD notional). Source: SDRView
Calculating Q1 2026 and Q1 2025 market share percentages from the volumes below Chart 5:
- Tradeweb group (led by TWSF) was the main D2C SEF compression platform group in Q1 2026 with a 53.3% share – up YoY by 1.0 points.
- Bloomberg group (led by BBSF) was the only other D2C SEF compression platform group with 5.7% – up YoY by 2.0 points.
- Off-platform compression (led by BILT) had a 40.0% share – down YoY by 2.4 points.
- D2D compression platform groups (OSTTRA Reset, BGC, TP, Tradition, and ICAP) combined for a total of 1.0% – down YoY by 0.6 points. BGC (down 0.5 points) was the main driver of the share decline.
To summarize, D2C SEF platforms took 2.4% from off-platform and 0.6% from D2D SEFs.
End note
- That is all for now. To recap the key takeaways, see the section near the top.
- Watch this space for regular coverage of this topic going forward, and for separate blogs on FRA, swaption and inflation swap compression.
- Contact us if you are interested in using SDRView.