Important current benchmarks like LIBOR, other IBORs and ICE SwapRate can have challenging characteristics during periods of high volatility. In some cases, price discovery can be difficult, which can be costly for some users and conversely rewarding for others.
In this blog I will look at a few of the current benchmarks and some of the alternative benchmarks. I will look at their robustness and moves during the recent period of volatility and what this may mean for the future.
When LIBOR is replaced by new benchmarks (Risk Free Rates or RFRs) then the design and use of these should ensure they are fit for purpose in all market conditions.
LIBOR – Operating as intended
LIBOR has been published as usual in all currencies during March 2020. The fact that FCA has the ability to ‘compel’ submitters to support LIBOR ensures this important benchmark continues to be published.
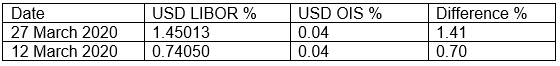
One interesting aspect about LIBORs generally is the way they move in periods of high volatility. This is especially clear when looking at the spread between 3-month LIBOR and 3-month OIS (calculated from SOFR futures).
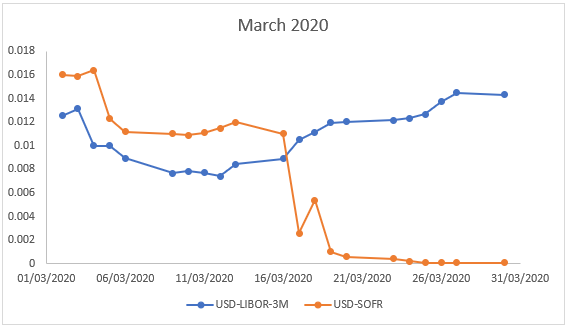
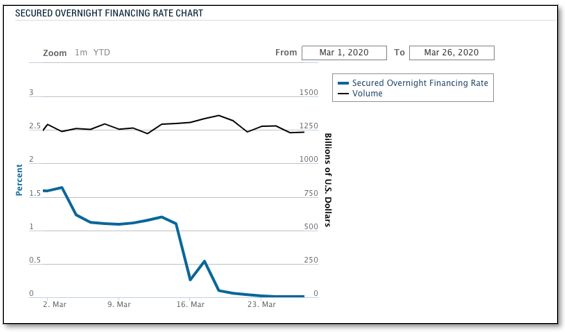
And charting 3-month USD Libor fixings versus SOFR in March 2020, shows the divergence from the middle of the month.
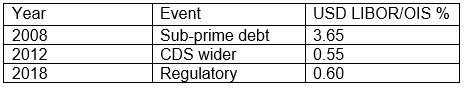
The longer-term range for the Libor-OIS spread is typically 0.10% to 0.25% but at times of market stress the spread can expand rapidly. A few extreme examples for 3-month USD LIBOR are below:
For GBP, the current difference is smaller than in USD.

The GBP LIBOR/OIS spread this time is considerably less than the USD LIBOR/OIS spread now but this is relatively unusual. The funding challenges (leading to LIBOR rising relative to OIS) have usually impacted both currencies. This time it is more apparent in USD than GBP.
Another interesting aspect is the IBOR fallback spread which ISDA will use in the new documentation. From the Clarus Term RFRs page for fixing date 27th March 2020 and the 3-month Libor from 3-months prior to this:
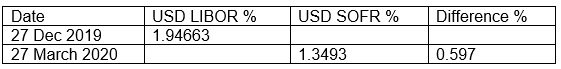
This difference will rise over the next few months: USD LIBOR set in the 1.6 to 1.8% range until March 2020 while the 0% Target rate will cause the SOFR (compounded) to fall to near zero by June 2020 and the difference to expand to around 1.5%.
Other IBORs – generally operating well
Most of other IBORs have performed as expected and similarly to USD LIBOR. Those which have submitted rates (e.g. CAD CDOR and HKD HIBOR) continued publication as expected.
Trade or quote-based benchmarks (e.g. AUD BBSW) were also published as usual as they have commitments from key market participants to provide quotes in the absence of trades.
The trade-based benchmarks tend to be relatively well supported in the early stages of high market volatility as the key dealers attempt to shore up funding requirements and borrow/issue larger than usual volumes. This can be seen in the BBSW turnover volumes.
In the majority of cases, the IBOR/OIS spreads move out in a similar way to USD LIBOR/OIS. However, this increase has generally been quite contained (e.g. AUD 3-month BBSW/OIS has increased from 0.20% to 0.30% during March 2020).
ICE Swap Rate – has challenges
Risk published an interesting article on 20th March 2020 highlighting the challenges for benchmarks based on committed bids and offer such as ICE Swap Rate.
At times of high volatility, the Risk article suggests dealers are less willing to stream prices to electronic broking platforms which are used to collect the data required to form the bid and offer.
On a number of days the ICE Swap Rates were not calculated from current market rates and used an interpolation methodology instead. This has led to a number of concerns for users of Swap Rate (e.g. cash-settled swaptions) who have had to rely on fallbacks to replace the benchmark.
SONIA and SOFR
The alternative rates, SOFR and SONIA, continue to publish as expected.
SOFR has set within the target range on the majority of days in March 2020 with consistent volumes of trades supporting the calculation. The range has been larger than usual on some days (e.g. 16th March) but the benchmark managed to set at a level within target.
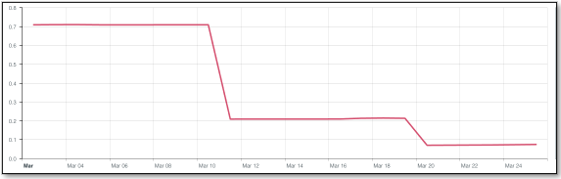
SONIA likewise has been consistent and close to the base rate set by the BoE.
Both these RFRs are trade-based: they are calculated from actual trades done in the market.
Trading has continued despite (or perhaps as a result of) market volatility. Much like trade-based IBORs the market participants still have to trade and this supports the benchmarks.
Term RFRs
Term RFRs are under development in a number of currencies ( e.g. GBP and JPY).
The methodologies for these benchmarks can be based on either committed bids and offers or trades in OIS. Chris Barnes recently commented on these options.
For example, in the GBP markets FTSE Russell, ICE and Refinitiv have proposed calculating a benchmark based on committed bids and offers.
However, IHS Markit has proposed using trades to calculated the GBP term RFR rather than the bids and offers.
Risk (in the same article as above) also questioned the ability of the broker markets to consistently produce an OIS bid/offer during March 2020.
The lack of continuity of committed bids/offers under volatile and challenging markets has impacted the Term RFR development as well as the ICE Swap Rate.
But how does the trade-based calculation fare over the volatile March period?
Clarus CCPView shows GBP OIS volumes each day in March 2020 around £80 – £100 billion per day with some very large days in early March (£500 – £950 billion). The following chart shows the volumes traded in GBP millions for March 2020.
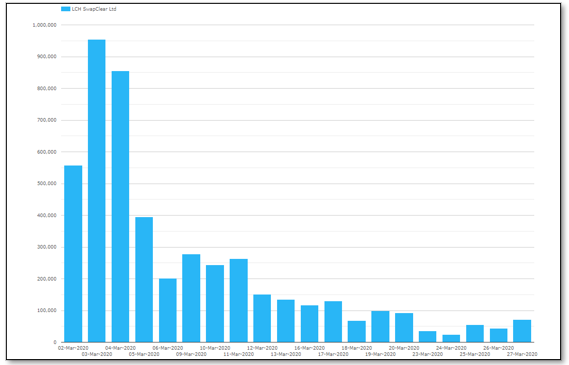
It appears there are sufficient trades and volume for a trade-based Term RFR to be calculated in GBP so far in March 2020.
But time will tell and become clearer once the Term RFRs are published for GBP by each methodology.
Summary
Robust benchmarks are a critical part of markets from derivatives to loan and debt markets. The continued performance of the benchmarks over periods of high volatility is vital for many markets to continue operating efficiently.
Submission based benchmarks like LIBOR are inherently robust especially since many are backed by regulatory compelling rules which ensure there will always be a published rate.
But with limited price discovery in volatile and often illiquid markets, are the submitted prices accurate?
Other benchmarks based on committed bids and offers like ICE Swap Rate can have significant challenges finding bids and offers on electronic broker platforms in high volatility as dealers may likely become reluctant to stream prices.
This is potentially (and likely) a problem for the proposed benchmarks like Term GBP SONIA and Term JPY TONAR if they are dependent on bids and offers from the same broker platforms as currently supply ICE Swap Rate.
Trade-based benchmarks like SOFR, SONIA, BBSW and the Term GBP SONIA (when calculated from actual trades) appear to perform well during periods of high volatility. They are supported by actual funding or hedging requirements which typically continue through times of high volatility.
With LIBOR cessation in sight, the performance of alternative benchmarks in all market conditions will be vital.
And, as per IOSCO Principles for Financial Benchmarks published in July 2013, using actual trades appears to be the best alternative.