Given the large moves in Swap rates that we highlighted in our BREXIT Day One and Day Two blogs, I thought it would be interesting to look at the impact on Swap margins.
Cleared IRS 10Y
Lets start by using CHARM to calculate the IM of 10Y par vanilla swaps in EUR, GBP and USD.
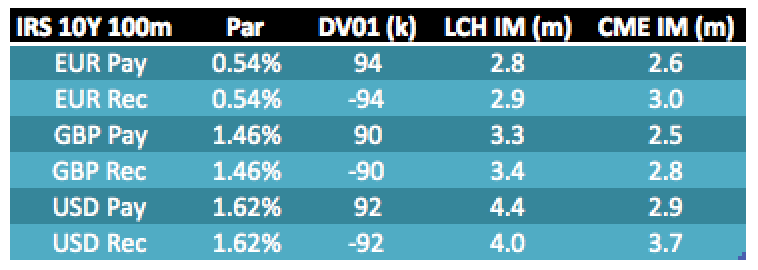
Showing that on 23 June (1-day prior to BREXIT):
- Par rates for each of EUR, GBP, USD IRS
- DV01 in thousands for a 100 million notional swap
- LCH IM in millions, which is highest for USD Pay at $4.4m
- CME IM in millions, which is highest for USD Rec at $3.7m
- (Both IMs are for House accounts, Client IM is higher)
Variation Margin Moves
If we had put on these trades on 23 June, then we would be subject to daily VM and again using CHARM we can calculate this VM over the two business days after BREXIT.
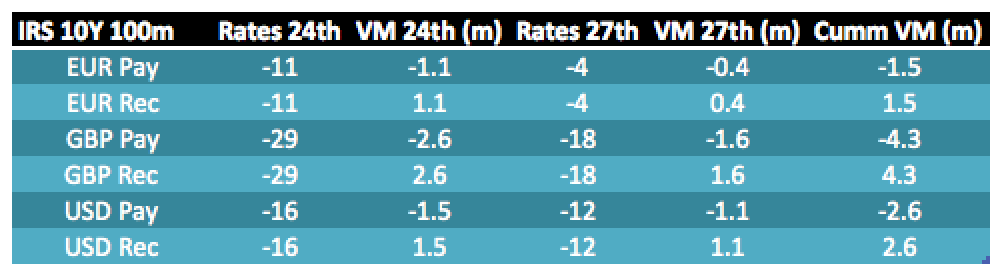
Showing:
- Move in 10Y Swap Rates on 24th in bps
- VM for the 24th in millions
- Move in 10Y Swap Rates on 27th
- VM for the 27th
- Cumulative VM over the two days
What immediately stands out are the large Rate moves in GBP and the Cumulative VM of £4.3 million.
This is the higher even then the IM at LCH or CME (see first table) and by more than £1 million!
Given that IM is the potential loss over a 5-day period this is a surprising result.
However it is not surprising when you consider that LCH uses a 10Y historical period, while CME uses 8Y and the BREXIT event type moves are un-precedented in recent history. Witness the fact that GBP/USD is at 31 year lows and while I don’t have convenient access to such a long historical period for GBP Swap rates, can imagine these moves are similarly larger than recent history.
For EUR & USD, the cumulative VM over these two days is less than the respective IM, so at least in these currencies the IM is adequate and the historical period used in the IM model must contain larger shocks.
VM Calls
Members and Clients with accounts that were Pay Fixed (long DV01) will have faced large VM calls on both 24 June and 27 June. This was true for EUR, GBP and USD positions as in each swap rates dropped significantly.
For GBP the moves were particularly severe, cumulative VM of £4.3m for £90,000 DV01 at 10Y.
For an account with a DV01 of positive £1 million, the VM calls would have added up to £48 million!
IM Scenarios
Lets now look in more detail at the IM model and the historical shift scenarios that determine IM.
Using CHARM we can isolate just the tail loss scenarios that determine IM. For LCH the worst six losses are averaged to get IM, which means that a loss has to be at least larger than the sixth largest to influence IM. We call this the LCH Tail Scenario.
Lets create a table for our Swaps.
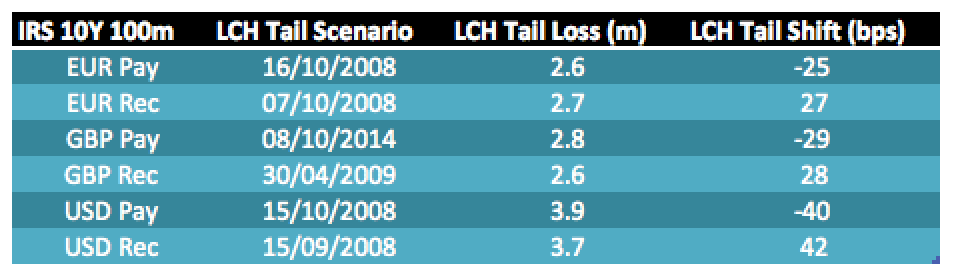
Showing that:
- Tail Scenario dates are mostly in Oct 2008 (Lehman’s bankruptcy)
- For GBP Pay the Tail Scenario is the 5-day period ending 8 Oct 2014
- This has a loss of £2.8m and a 10Y shift of -29 bps
- For USD the shift is -40 bps
This suggests the reason why the LCH IM was adequate for EUR & USD and not for GBP.
For GBP we have seen a 2-day move of -47 bps, much higher than the -29 bps of the tail scenario. While for USD the 2-day move of -28 bps is less than the -40 bps of the tail scenario. (In-fact for GBP the worst-loss tail scenario is -38 bps on 26 Nov 2008 resulting in a £3.5m loss)
A similar argument as above will hold true for CME, but time prevents me from laying out it in the same detail.
Change in IM?
Lets now turn to IM and the possible impact of these scenarios.
Both LCH and CME use variants of filtered Historical Simulation as their IM model and this has the following characteristics:
- Volatility scaling, the IM increases as volatility rises
- Recent shifts are given more weight than older shifts in history
Both of these suggest that IM will start to increase for EUR, GBP and USD.
Lets look specifically at GBP Swaps at LCH and construct a table of daily prices and shifts.
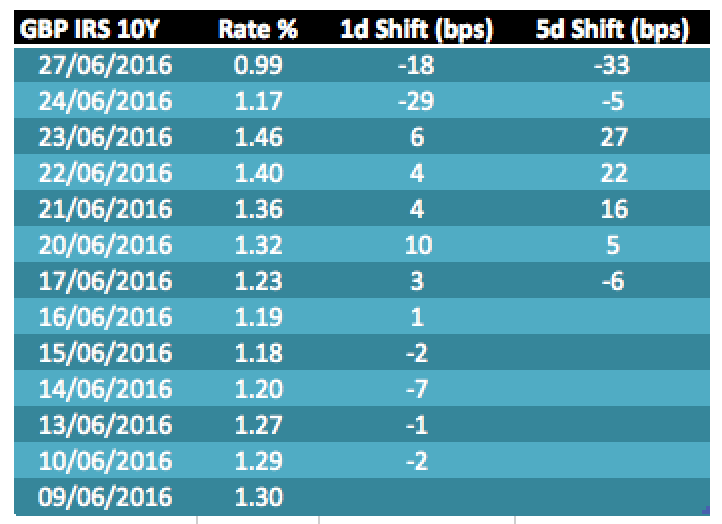
Showing:
- Par Rates for the thirteen most recent days
- 1-day absolute shifts in basis points
- 5-day absolute shifts in basis points
And we see that that 5-day period ending 27 June has a shift of -33 bps.
Now LCH SwapClear shift scenarios are updated daily with a weekly lag, so only from 1 July onwards will the large BREXIT scenarios start to be used. And we know that for GBP they will enter into the loss tail and further increase IM.
So while increased volatility will lead to an increase in overall IM, for GBP Swaps the impact will be far more noticeable as new tail scenarios will start to influence the LCH IM.
The potential increase can be estimated depending on our assumptions on whether rates will remain low or bounce back a bit (as we are starting to see on the 28th). This gets more involved and I will leave it those of you interested to work out yourself (ping me if any questions).
Now CME do not have a weekly lag in their historical scenarios and so GBP Swaps at CME will already be seeing increased IMs. The CHARM screenshot below shows the worst eight loss scenarios for IM of our GBP Swap.
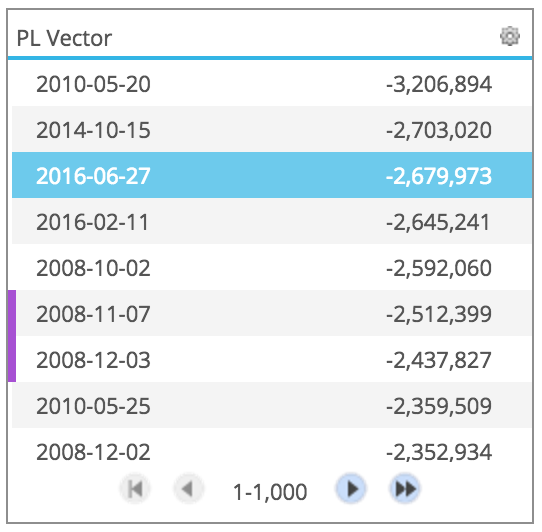
Showing that the third largest loss is now the 5-day period ending 27th June.
Thats it for today
There were large drops in Swap rates on the 24th and 27th.
These resulted in large VM calls for long DV01 accounts.
GBP positions were particularly exposed.
With VM over two days greater than IM!
IM will start to increase.
GBP positions are particularly exposed.
CHARM helps to analyse and understand your risk.