Let’s update my blog on IDB Market Share in SOFR Swaps with the most recent data and expand the coverage to also include D2C venues.
- SOFR Swaps trade as Outrights, SpreadOvers, Curves, Butterflys, Forwards/IMMs
- Market Share can be determined using trade count, notional or dv01
- Spreadovers are the largest in D2D trading
- Outrights are the largest in D2C trading
- We calculate share in dv01 terms for the April-July period
- In D2C Outrights, Tradeweb 61%, Bloomberg 37.5%
- In D2C Forwards/IMM, Tradeweb 70%, Bloomberg 28%
- In D2C Curves, Bloomberg at 52%, Tradeweb at 48%
- In D2C Butterfly, Tradeweb 51.5% and Bloomberg 48%
- In D2D Spreadovers, ICAP leads with 48%, BGC next with 21%
- In D2D Curves, ICAP leads with 36%, Tradition with 25%
- In D2D Butterfly, Tradition leads with 46%, Dealerweb with 20.5%
- In D2D Butterfly, Dealerweb has gained share to move into second
- See below for all the charts and details
Types of SOFR Swaps
SOFR Swaps in the IDB (inter-dealer broker, D2D) market trade primarily as Spreadovers to US Treasuries. This is by far the most frequent trade type in D2D, with the highest volume in notional or dv01 terms and the most important in setting prices of SOFR Swaps.
In dealer-to-client (D2C) trading the most common trades are Outright SOFR Swaps and these trade in very large volume in trade, notional or dv01 terms; generally greater than D2D Spreadovers.
Curve/Switch trades, which are relative value trades, taking a position on the spread between standard tenors (e.g. 5y10y) to narrow or widen and trade as either SpreadOver or Outrights. These trades do not have a direct impact on swap prices, but they do have second order impacts on the price levels.
Butterfly trades are similarily used for relative value between tenors e.g. 2y5y10y, trade in large size and have second order impacts on price levels, again either as SpreadOvers or Outrights.
As well as these main types, there are also:
- Forwards, which start not on spot but on a forward date e.g. 1Y
- IMMs, with dates that match CME SOFR Futures, for relative value or invoice spread trading
- CCPSwitch trades, which move risk from one CCP to another, either CME to LCH
Let’s look at these in turn, focusing on the market share of each trading venue in D2D or D2C.
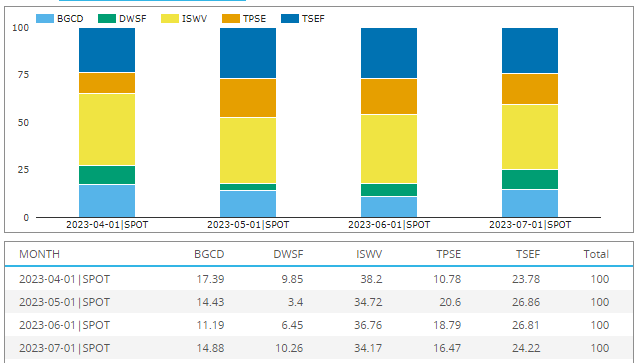
SOFR Spreadovers
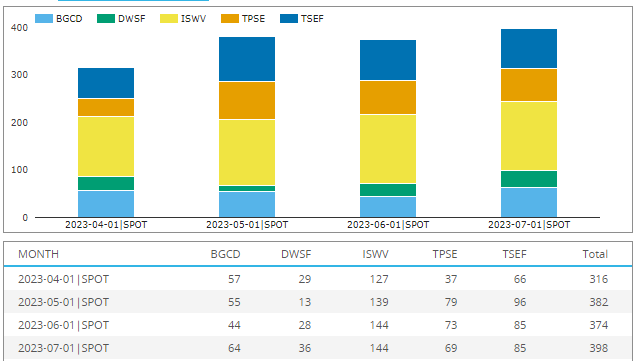
Starting in SDRView with D2D Spreadover trade counts by month and plaform identifier.
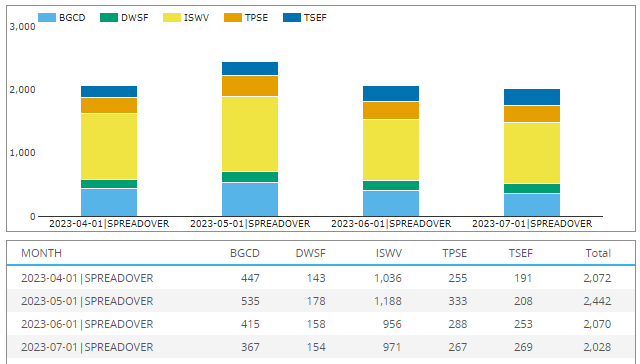
- Each month with at least 2,000 trades (and not shown, with gross notional > $140 billion pm)
- ISWV, which is ICAP Global Derivatives, the largest with around 1,000 trades a month
- ISWV share close to 50% of the trade count volume.
Let’s switch next to selecting DV01, a measure that equalises notional by tenor into comparable risk, is a better proxy for share of customer wallet and expressing the results as a percentage share.
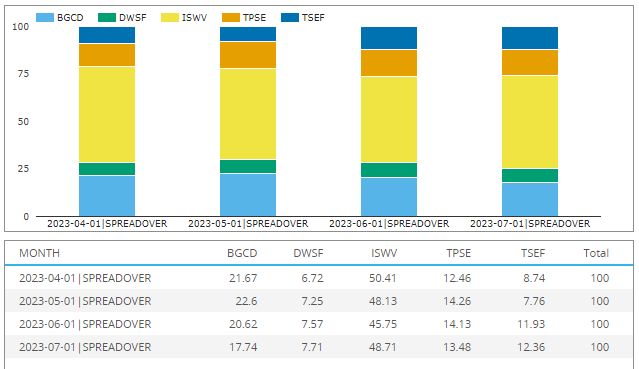
- ICAP share ranging from 50.4% to 45.8%, an average of 48.25%
- BGC share in the 22.6% to 17.7% range, an average of 20.65%
- TPSE, Tullet share in the 12.5% to 14.3% range, an average of 13.6%
- TSEF, Tradition share in the 7.8% to 12.4% range, an average of 10.2%
- DWSF, Dealerweb share in the 6.7% to 7.7% range, an average of 7.3%
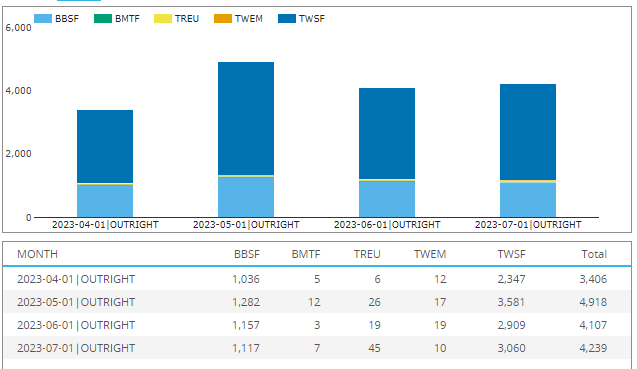
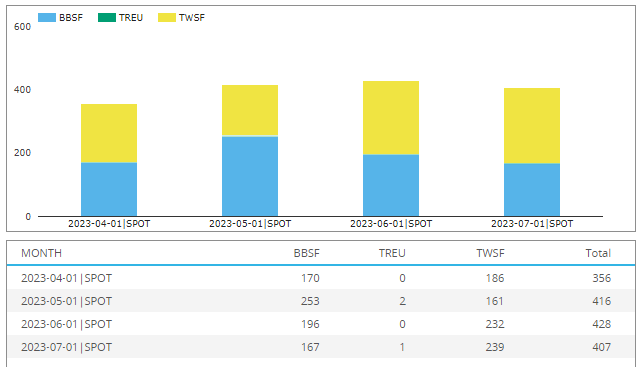
SOFR Outrights (Spot starting)
Next, lets switch to D2C venues and look at volumes and share of spot starting outright SOFR Swaps.
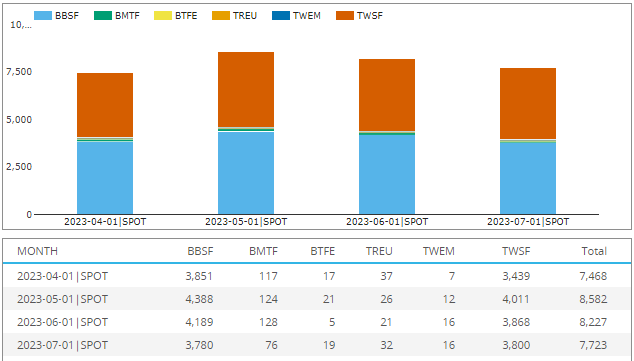
- Each month with 7,500 to 8,500 trades (and gross notional > $400 billion, not shown)
- So between 3 to 4 times the volume we saw in D2D Spreadovers
- Bloomberg and Tradeweb, each with 3 venues (US, UK, EU)
- Volumes look similar on BBSF and TWSF, a little higher on the former
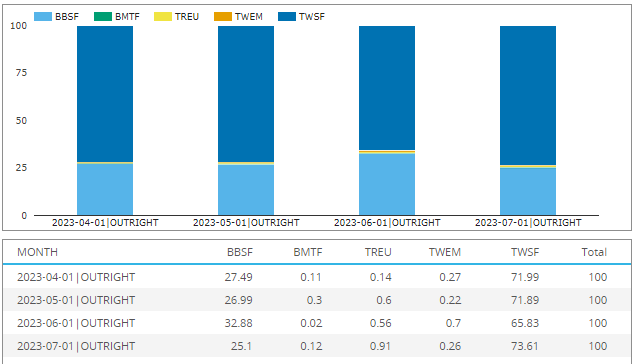
As before, in SDRView we can switch to DV01 and display percentages.
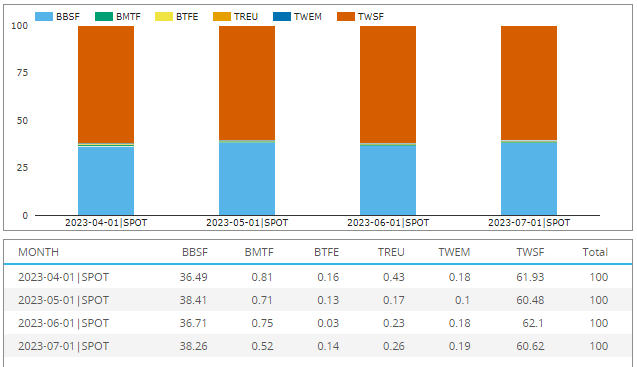
- TWSF, Tradeweb SEF the largest with an 61.25% average share
- Much higher in dv01 terms due to more notional in longer tenors than BBSF
- BBSF, Bloomberg SEF with 37.5% average share
- Cummulative share of the UK & EU venues is 1.25%
- BMTF and TREU, the UK venues a touch larger than BTFE & TWEM the EU venues
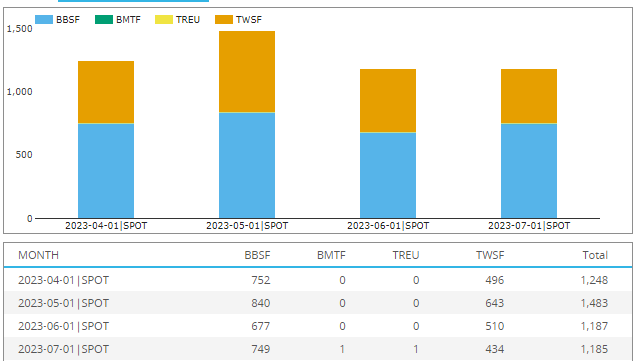
SOFR Outrights (Forwards and IMM)
Next, lets stick with D2C venues, but change from Spot starting to Forwards and IMM SOFR Swaps.
- Each month with 3,400 to 5,000 trades (and gross notional > $200 billion, not shown)
- So over 50% of the volume we saw in D2C spot starting outights
- Volumes on TWSF are 2 to 3 times higher than on BBSF (and higher in IMM than Forwards)
As before, in SDRView we can switch to DV01 and display percentages.
- Tradeweb SEF the largest with average share of 70.1%
- Bloomberg SEF with 28%
- Tradeweb (UK) with 0.59%, Tradeweb (EU) with 0.36% and Bloomberg (UK) with 0.15%
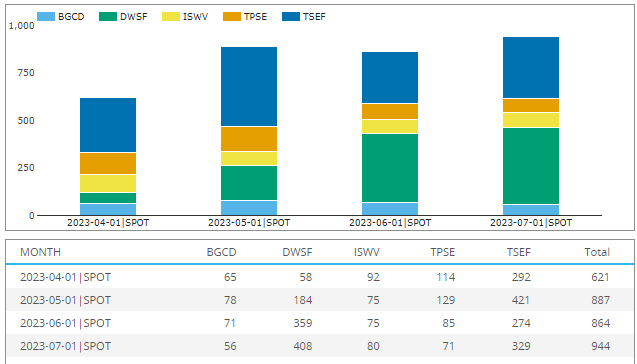
SOFR Curve/Switch trades
Turning to Curve trades (e.g. 5y10y), we will start with D2C venues.
- Counts (package adjusted) selected in SDRView, to avoid double-counting (each leg)
- Around 1,200 trades each month
- Bloomberg with more trades than Tradeweb, approx. 60% to 40% share
- Notional (package adjusted) $40 billion each month, so much smaller than Outrights or Fwds/IMMs
For the sake of brevity, I will skip showing the chart of DV01 share, but state that this shows an average share for the period of BBSF of 52% and TWSF with 48%.
Next lets turn to D2D venues and Curve/Switch trades, generally as Spreadover.
- Again using package adjusted trade counts
- 300-400 trades each month, so a quarter to a third of the D2C volume
- (Though in gross notional terms, more like half)
As before, in SDRView we can switch to DV01 (package-adjusted) and display percentages.
- ICAP share ranging from 34% to 38%, an average of 36%
- TSEF, Tradition average share of 25.4%
- TPSE, Tullet average share of 16.7%
- BGC average of 14.5%
- DWSF, Dealerweb average share of 7.5%
SOFR Butterfly trades
Next Butterfly trades (e.g. 5y10y30y), we will start with D2D venues.
- Using package adjusted trade counts (and not triple-counted legs)
- 600-900 trades each month
- TSEF, Tradition with the most trades in the period
- But DWSF, Dealerweb with the most trades in June and July
Switching the chart to DV01 (package adjusted) and percentage share.
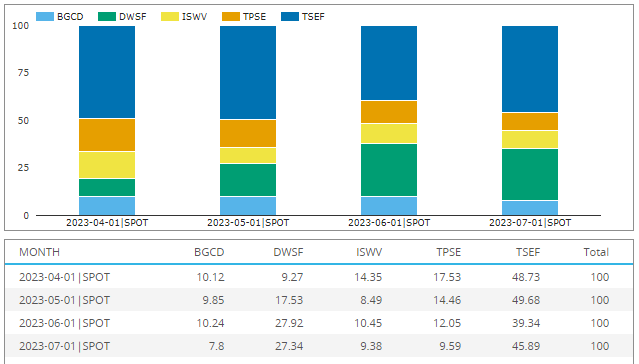
- TSEF, Tradition the largest with an average share of 45.9%
- DWSF, Dealerweb next, an average share of 20.5%
- TPSE, Tullet an average share of 13.4%
- ISWV, ICAP an average share of 10.7%
- BGC, an average share of 9.5%
Dealerweb gaining significant share in May and June and at 27.3% in July.
Switching to D2C and trade count.
- Using package adjusted trade counts (and not triple-counted legs)
- 350-400 trades each month, so half the volume compared to D2D
- BBSF and TWSF vying for the larger share each month
Skipping the dv01 share chart, we can simply state that the share is Tradeweb 51.5% and Bloomberg 48%.
Thats’ It
Twelve charts to cover market share in SOFR Swaps.
There is a lot more data in SDRView.
Daily, weekly, monthly, quarterly, annual.
Currency, Product, Subtype and Package type.
Trade counts, notionals, dv01.
Venue type (D2D, D2C, SDP, Off Venue).
Please contact us if you are interested in a subscription.