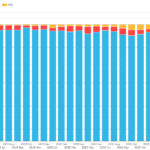
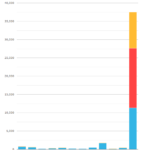
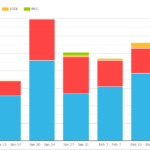
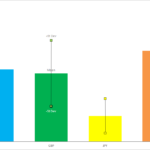
2021 SEF Volumes and Share – CRD and FXD
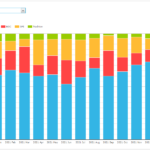
Today I review 2021 Swap Execution Facility (SEF) volumes and market share for both Credit Derivatives and Foreign Exchange Derivatives, in a similar format to my 2020 SEF Market Share Statistics article. Summary: CRD Index, Option and Tranche products Volume in USD of $7 trillion, down 8% from the prior year Volume in EUR of $4.3 […]
You Need To See This SEF Liquidity In RFRs Now
USD SOFR trading on D2C SEFs is very small, and well behind the industry average. 72% of GBP risk was versus SONIA on D2D SEFs in April 2021. CHF SARON adoption has jumped to 15% on D2D SEFs this month. RFR Adoption Indicators In this blog I turn the RFR Adoption Indicator methodology onto SEF […]
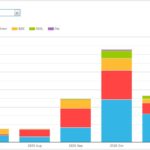
Latest: More EUR Are Trading on-SEF than ever before
16% of the global EUR D2D swaps market is now on-SEF. This has recently increased above the levels we saw in January 2021. We do not know why there has been another increase in EUR SEF trading. But the data shows it is happening! US venues continue to be the main beneficiaries of Brexit in […]
US SEFs now have 20-40% of European Derivatives
Following up on our analysis of the Brexit effects on Rates markets and Credit markets we estimate how much of the swaps market is now executing on-SEF. The extent of the move varies from currency to currency and between Interbank markets and their Clients. We look at each market in turn. The Irony The laws […]
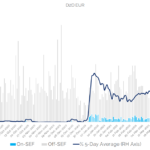
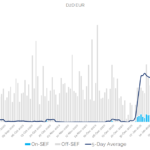
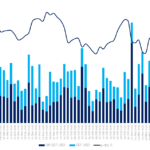
New Brexit Rules Move $4Trn Of Derivatives To The US
Brexit has moved over $4Trn in derivatives out of UK/European execution venues and onto US SEFs. Interdealer volumes in EUR and GBP products executed on US SEFs have increased by ~10 times in 2021. This is a consequence of certain products subject to a Trading Obligation in Europe (and the UK) executing on US registered […]
2020 SEF Market Share Statistics
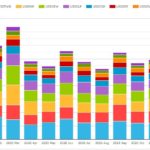
In this article I look at 2020 Swap Execution Facility (SEF) market share for Credit, Foreign Exchange and Interest Rate Derivative asset classes, in a similar format to my 2019 SEF Market Share Statistics. Summary: CRD Index, Option and Tranche products Volume in USD up 17% and in EUR up 12% March 2020 a huge month […]
Anonymous Trading on SEFs
The 1st November 2020 heralded a fundamental change in swaps markets. SEFs executing trades in specific products were no longer permitted to disclose the identities of the counterparties (to each other) after the trade: At the moment, this rule only applies to MAT swaps – i.e. those products subjected to the execution mandate and required […]
SOFR Swaps on SEFs
Last week I looked at Swap Volumes in October 2020 and focused primarily on SOFR Swaps and Futures at Clearing Houses, so this week I am going to look at Swap Execution Facilities (SEFs). D2D SEFs Let’s start by using SEFView to look at D2D SEFs, where the main product is SOFR v FedFunds Basis […]
SOFR Swaps and SEF Venues
We have dedicated Risk Free Rate (RFR) views in most of our data products and today we complete the picture by adding these to SEFView, which aggregates daily volume from all Swap Execution Facilities. Let’s use this to see where SOFR Swaps are trading. D2D Venues The inter-dealer market trades SOFR vs FedFunds Basis Swaps, […]
Block Trading
Our data shows that block trades are 30% larger than the amounts reported to SDRs. Block trades and trades capped at a reporting threshold make up just 7% of volume by trade count. However, the true size of these trades means they account for 43% of notional volume. This varies significantly from currency to currency. […]