
April 2017 Swaps Review
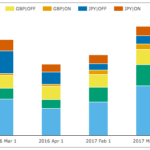
Continuing with our monthly Swaps review series, let’s look at volumes in April 2017. Summary: SDR USD IRS price-forming volume > $1.8 trillion gross notional SEF Compression activity in USD IRS > $250 billion USD OIS volume was > $2 trillion Both USD IRS and OIS are well down from recent highs EUR IRS and OIS volume is mostly Off SEF SEF USD, […]
Swaps Data: ETD vs OTC, USD IRS, OIS and NDF
Highlights of this months Swaps Data Review article include: Initial Margin at LCH, CME, ICE, Eurex (as of Dec 31, 2016) ETD IM of $191 billion and OTC IM of $171 billion With ETD and OTC splits for each of the four CCPs LCH SwapClear Client IM for the first time just exceeded House IM SwapClear […]
March 2017 Swaps Review
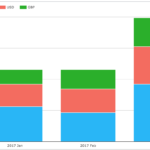
Continuing with our monthly Swaps review series, let’s look at volumes in March 2017. Summary: SDR USD IRS price-forming volume > $2.5 trillion gross notional The highest month ever and 23% up from a year earlier SEF Compression activity in USD IRS > $320 billion The second highest month on record USD OIS volume at > $4.5 trillion is up 33% from previous high […]
Monthly Swap Data review: Libor dominance challenged
My monthly Swap Data review was published on Risk.net, see here for the article. (no subscription required)
February 2017 Swaps Review
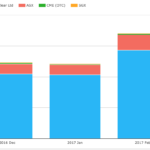
Continuing with our monthly Swaps review series, let’s look at volumes in February 2017. Summary: SDR USD IRS price-forming volume > $2 trillion gross notional 8% lower than a year earlier On SEF vs Off SEF at 65% to 35% SEF Compression activity in USD IRS > $230 billion USD OIS volume at > $3.3 trillion is massively up (3 times Feb […]
Swaps Data: Volumes rise, CCP Switches Spike
I wrote an article for Risk.net, reviewing recent trends in Swap volumes, available at this link. (Complete with my bang up to date picture, time has flown by ……, only 15 years to be precise.)
January 2017 Swaps Review
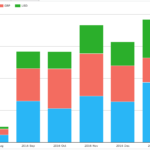
Continuing with our monthly Swaps review series, let’s look at volumes in January 2017. Summary: SDR USD IRS price-forming volume > $2.3 trillion gross notional 21% higher than a year earlier On SEF vs Off SEF at 62% to 38% is lower than average; 65% to 35% SEF Compression activity in USD IRS was > $220 billion USD OIS volume at […]
2016 SEF Market Share Statistics
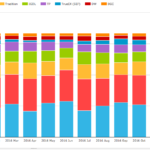
In this article I will look at Swap Execution Facility (SEF) volumes and market share in 2016 for Credit, Foreign Exchange and Interest Rate Derivative asset classes. Clarus SEFView collects daily volumes published by each SEF and normalises this data to allow meaningful comparison and determination of market share statistics. Summary: CRD Index, Option and […]
December 2016 Swaps Review
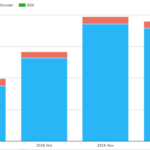
Continuing with our monthly Swaps review series, let’s look at volumes in December 2016. Summary: SDR On SEF USD IRS price-forming volume >$1.3 trillion gross notional 13% higher than a year earlier SEF Compression activity was >$350 billion in USD IRS The highest month on record and 66% higher than a year earlier USD OIS surprisingly has Off SEF volume up and On […]
November 2016 Swaps Review
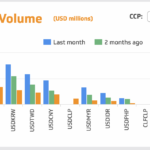
Continuing with our monthly review series, let’s review Swap volumes in November 2016. SDR highlights: On SEF USD IRS price-forming volume in November was > $1.5 trillion Almost 50% higher than the prior month USD Swap Rates were up 50 bps for 10Y, with a steeper curve SEF Compression activity was > $250 billion in USD IRS On SEF EUR, GBP, […]