- We focus on Bond Futures.
- They are a deep source of liquidity.
- We define the contracts and look at some of their common features.
- Analysing volumes across major bond futures is simple in CCPView.
- We find that around 60% of bond future notional is US related, with the remainder European.
- Invoice Spreads account for 3% of volumes in bond futures.
What is a Bond Future?
We can broadly define a Bond Future as;
- A physically deliverable futures contract
- An underlying (government) bond, that matches the deliverable criteria, must either be delivered on a given date (Eurex) or during a given time window (CME).
- Expiry dates are quarterly in March, June, September and December, but may be on the 10th of the month (Eurex) or during the month (CME).
- The prices are quoted with reference to a “standard” bond contract with a defined yield to maturity of 6% (CME and Eurex) or 4% (LIFFE).
- The tick value of a bond future is the smallest price increment possible multiplied by the face value. For Eurex bond futures (which are quoted in decimals and quoted with 0.01% increments), this makes life straight-forward – the tick value is EUR10, apart from Schatz (2 year contracts) which can move in 0.005% increments and hence have a EUR5 tick value. For CME, it varies with the futures contract, from $7.8125 to $31.25. See page 3 of their guide.
- The actual invoice price of the deliverable bond is calculated using a Conversion Factor.
I don’t want to write a whole post on Conversion Factors that could easily cause otherwise-interested readers to glaze over and lose the will to read on. Suffice to say that because bond futures are not based on a single underlying bond issue, but rather a basket of eligible (“deliverable”) bonds, there is always a bond that makes more economic sense than others to deliver. Therefore, the market assumes that any contract seller will always deliver this “cheapest to deliver” bond in the event of delivery.
Bond futures therefore trade in line with this underlying cheapest to deliver bond.
For reference, the CME provide a calculator here, Eurex here and LIFFE here. I particularly like the way Eurex explain the calculations here which is both concise and clear.
Generally speaking, we can see that bond futures are not as standardised across different markets as Short Term Interest Rate futures. This is hardly surprising given that bond markets themselves are also more diverse than money markets. Nonetheless, bond futures provide just as much (if not more) liquidity than STIRs.
Bond Future Volumes
A monthly chart of volumes showing Eurex (EUR) and CME (USD) bond future volumes tells us a good portion of the story here:
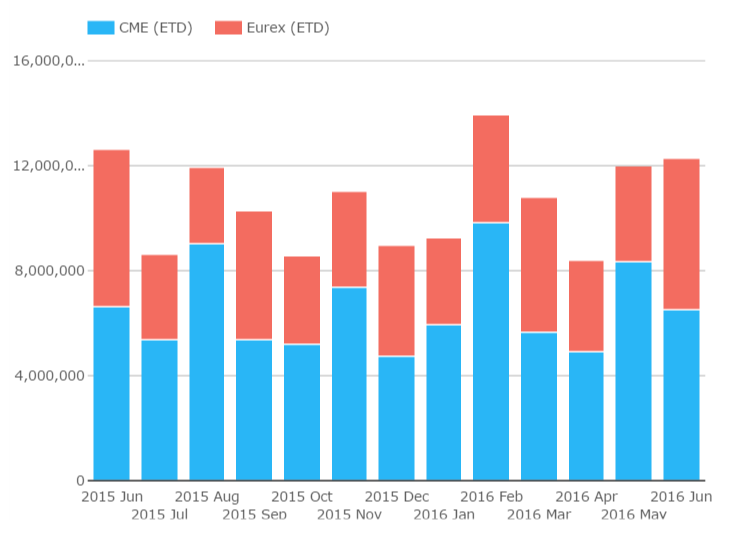
Showing;
- Volumes in notional terms (i.e. face value of the contracts).
- Volumes are huge. So huge, they don’t really fit on the chart! We are talking million-millions of face value – i.e. over $12 trillion in some months. And people think that swap markets are big…..remember we struggle to get over $2trn for USD swaps each month! And USD swaps trade as a contract for difference (between the fixed and floating rates), just as a bond future trades as a CFD (between T zero and T minus one prices).
- Bear in mind that the chart shows volume – or some people think of it as turnover – so this chart does not reflect the size of positions.
- Eurex positions typically roll within the month of delivery, where-as CME positions typically roll the month before delivery. For that reason, the “market share” of Eurex vs CME (albeit across different currencies and across different government bonds) shows a see-saw pattern.
- For non-roll months, CME has around 60-63% of bond future notional traded across it, with Eurex making up the rest. We do not, as yet, include LIFFE Gilt futures.
So, what about the Swap Market?
Swap markets and government bond markets are intrinsically linked. They are also explicitly linked via Invoice Spreads. This is a particular type of Asset Swap, and we’ve looked at volumes in the past and more recently for the new Ultra10 CME contract.
Using SDRView Researcher, we can quickly filter out all invoice spreads in our forward starting universe. We end up with the following chart of volumes for invoice spreads during June 2016:
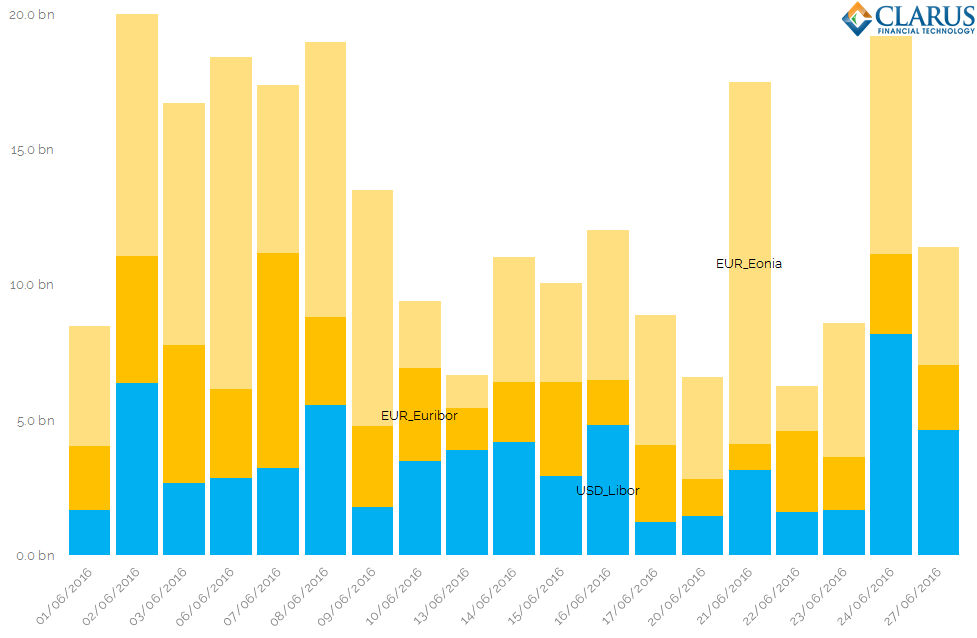
Showing;
- All Invoice Spreads identified in the USD Swap market were against USD Libor (specifically, the USD Libor 3m index).
- For EUR Invoice Spreads, trades versus EONIA are just as prevalent as trades versus Euribor (mainly 6m, plus some 3m trades). I looked at these Eonia trades (a long time ago!) as an example of how strange the market structure in swap markets can be.
- Overall, the chart shows that it is very common to have total Invoice Spread volumes reaching $20bn per day. This makes it a significant portion of the Rates market.
- Whilst this may seem only small in comparison to the actual Bond Futures volumes, which are orders of magnitude higher, it is worth stating that many of these Invoice Spread trades will be adding to or establishing positions. The velocity of risk recycling between market participants is much lower for Invoice Spreads than for the underlying bond futures themselves.
Combining the two charts and data sets in this blog, we can see the following characteristics for Invoice Spreads:
- In USD, 2.1% of all bond future notional traded in June 2016 was related to Invoice Spreads.
- In EUR, 2.9% of all bond future notional traded in June 2016 was related to Invoice Spreads. In notional terms, Eonia structures traded over twice as much as Euribor structures. This may be skewed by a preference towards Schatz-Eonia as a long term repo play, but that requires more investigation.
It is also worth noting that a large proportion of USD Invoice Spreads traded on a single day (28th June, not shown on the above chart). Was this all position rolling or is an end of month spike common? I will leave it to Clarus subscribers to interrogate the data further.
Wrapping Up
- In terms of notional traded, bond futures represent a much larger market than Swaps.
- In USD markets, around 3 times as much notional-equivalent trades in bond futures than in Swaps per month.
- Even though Invoice Spreads themselves are only a portion of the Swaps market, we see that they drive between 2 and 3% of volumes in bond futures.
- European markets have a somewhat convoluted market structure, such that Invoice Spreads versus Eonia are even more common than versus Euribor.
It will be an interesting future exercise to start measuring the proportion of risk traded in each market (swaps, futures, swaps vs futures, Bonds vs STIRS etc…..). Crucially, we will be able to monitor how this mix changes over time.
Subscribe to keep in touch with this future research.
As always a very interesting analysis. I think it would be very interesting to include the active government bond futures markets in UK, Korea and Australia as well in your analysis. Yes, they are easily dwarfed by Eurex and CME markets, but I wonder what how their ratio of OTC IRS vs. bond futures will look like over time, especially given that the last two futures contracts are cash settled and probably easier accessible than IRS. And just a thought, when considering STIRS, shouldn’t you also include the well developed 1-day deposit rate futures in Brazil as well?
Thanks Frank. We are always looking to add different products and CCPs into the mix, so I expect it will expand over the coming months. I certainly wasn’t aware of the Brazilian STIRS, I’ll take a look at those now!