Reading a Bloomberg article today, Swaps Boom is Unintended Consequence of New Curbs on Wall Street, it seems that instead of trading investment-grade bonds themselves investors are increasingly turning to derivatives. The reason given that they cannot get quickly in and out of cash bonds as dealers are pulling back from debt trading.
While the figures quoted in that article appear to be investment grade single names, I thought I would look at Investment Grade CDSIndex Volumes, in a similar fashion to my recent article on A Six Month Review of Interest Rate Swap Volumes and see what the data shows.
North America and Europe
Lets start by by using SDRView Res to look at the two major contracts, CDX.NA.IG and iTraxxEurope, total volume by month.
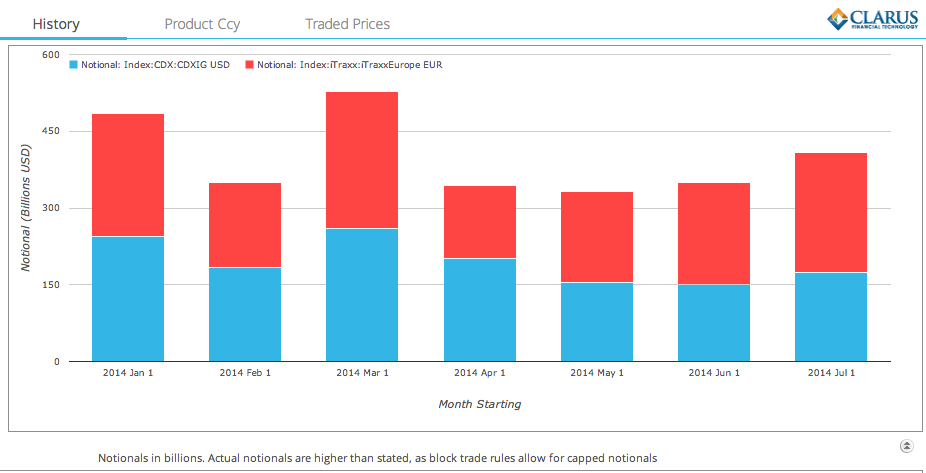
From which we observe:
- The expected spike in March, due to the series roll
- A steady but un-spectacular pick-up in volumes since then
- iTraxxEurope volumes exceeding North America IG in each of the last 3 months
- Perhaps not surprising given the European news (ECB, Portugal, …)
Now lets look at ON SEF volumes:
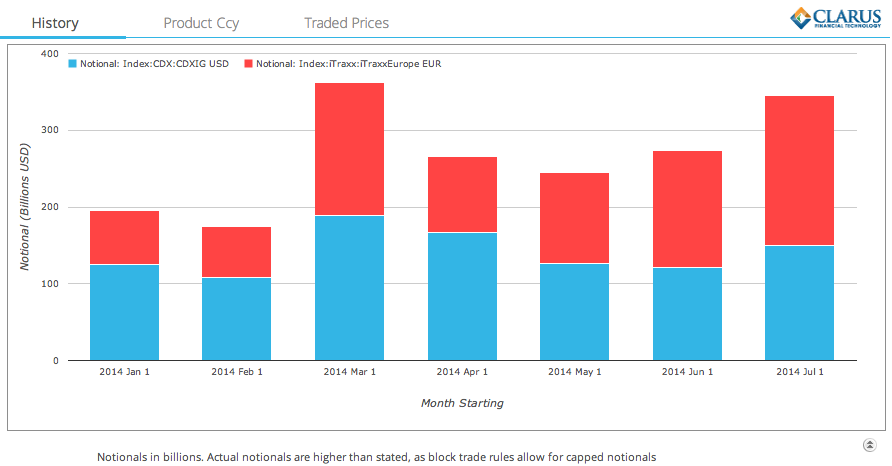
Which show a greater rise in volumes since March, much as we would expect given the MAT dates for these products
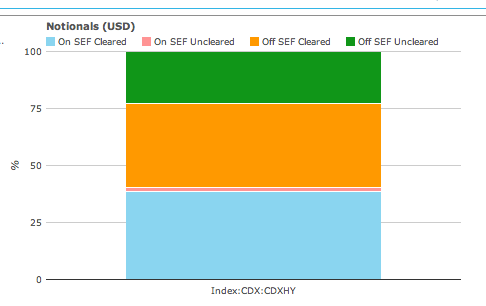
Percent ON SEF vs OFF SEF
Lets now compare On SEF vs Off SEF, just for CDX.NA.IG for the month of January vs July, first January:
And then July:
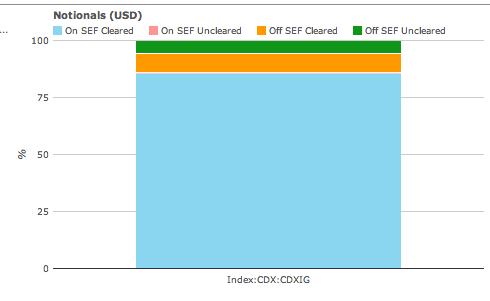
From which we can see:
- On SEF Cleared has increased from 55% to 86% of total volume
- Off SEF Cleared has decreased from 23% to 8%
- Off SEF Uncleared has decreased from 18% to 6%
The trend is as we would expect given the expiry of package exemptions in May and June.
August Volumes
What of more recent volumes?
Lets look at On SEF by week for the most recent 12 weeks.
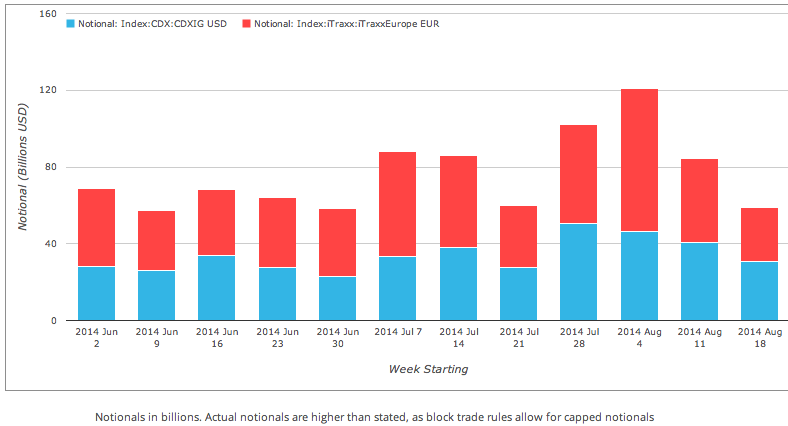
From which we can see that:
- iTraxxErope continues to show higher volumes than CDX.NA.IG
- Week starting Aug 4, had the highest volume with > $75b in iTraxxEuope and > $46b in CDX.NA.IG
- Most recent 4 weeks show >$198 for iTraxxEurope vs $170b for the prior 4 weeks
- Most recent 4 weeks show >$168 for CDX.NA.IG vs $121b for the prior 4 weeks
So volumes have continued their steady climb.
SEF Market Share
And what has been happening to market share?
We can use SEFView to find out.
Again focusing solely on CDS.NA.IG and iTraxxEurope for the past 12 weeks, we see:
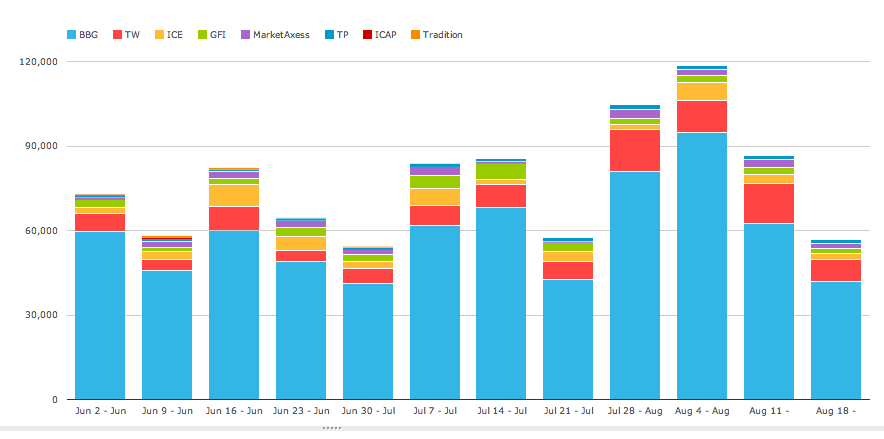
Which show the same trend as in the previous chart.
However the amounts differ as SEF volumes are not capped as the SDR ones are.
Lets now change the chart to show percentage of total:
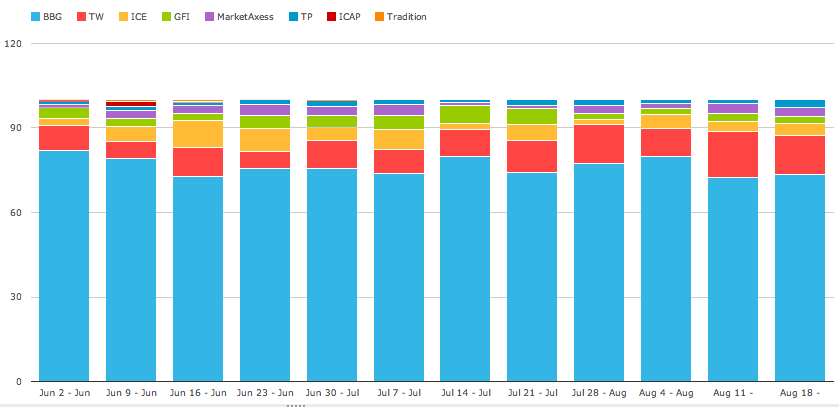
From which we can see:
- Bloomberg continues to have the lions share of around 75%
- Tradeweb has increased its share to between 10-15% (up from 6-10% at the start)
- ICE and GFI have lower share than at the start of the period
- MarketAcess and Tullets seem little changed
Summary
CDSIndex volumes show a steady rise in 2014.
This is particularly evident in On SEF volumes.
iTraxxEurope volumes have been higher than CDS.NA.IG, reflecting the greater market focus on European policy.
August volumes are on track to exceed July and be close to March highs.
Bloomberg continues to capture the lions share of trading in these contracts, approximately 75%.
Tradeweb has made gains over the past 3 months and is now in the 10-15% range.
The CDSIndex market is picking up steadily.
It will be interesting to see what the reminder of the year holds.