They say a picture is worth a thousand words. But if you are like me, it’s hard to quantify, because getting through 1,000 words can be quite tough. By the 100th word you’re skipping ahead to find the bulletpoints, bolded sections, and charts.
It occurred to me recently that we at Clarus have reams of data, and it’s quite easy to get lost in details. We perform data normalization and enrichment on SDR data, SEF data, and clearing data; and we’re often comparing this to other data sources (BIS reports, CFTC weekly reports, ISDA papers, research papers, etc).
Like any data, unless you know what you are looking at, it’s very easy to get confused. We often get “silly” questions from casual users (of our freeview data products), as well as some from our clients (on paid subscriptions) – and when I say “silly” I mean they sometimes don’t appreciate the universe of data that they are looking at.
So let’s quickly recap the separate data sources that we normalize in our data products:
- Clearing data. This is the world of cleared derivatives at global clearing houses. Clarus CCPView digests this, with a focus on OTC swaps, but also has some exchange traded derivatives as a benchmark.
- SDR data. This is the world of US-named, CFTC governed, swaps business. This spans both cleared and uncleared, as well as On and Off SEF. Clarus SDRView normalizes and enriches this data.
- SEF data. This is cleared and uncleared swaps business transacted on a registered venue. 100% of this is reported to SDR, so is fully contained within SDR data, however it is a separate source of data, full of valuable quirks that is not available in SDR data. Clarus SEFView normalizes this data.
The silly questions I refer to are things like “why are the LCH cleared swaps numbers much larger than the total executed on SEF”. Well, of course because LCH handles bilaterally executed swaps, as well as the rest of the world outside of America.
So I set out to describe this in pictures, to give people an appreciation of what they are looking at when they use our data. Note I will not use tables, line charts, bar charts, or even numbers for that matter. I will use Venn diagrams. Unfortunately, I will have to use some words.
Data
Let’s begin with May activity to date.
The largest, primarily pink circle, is the world of global cleared swaps. The green circle is SDR data, and grey is SEF data.
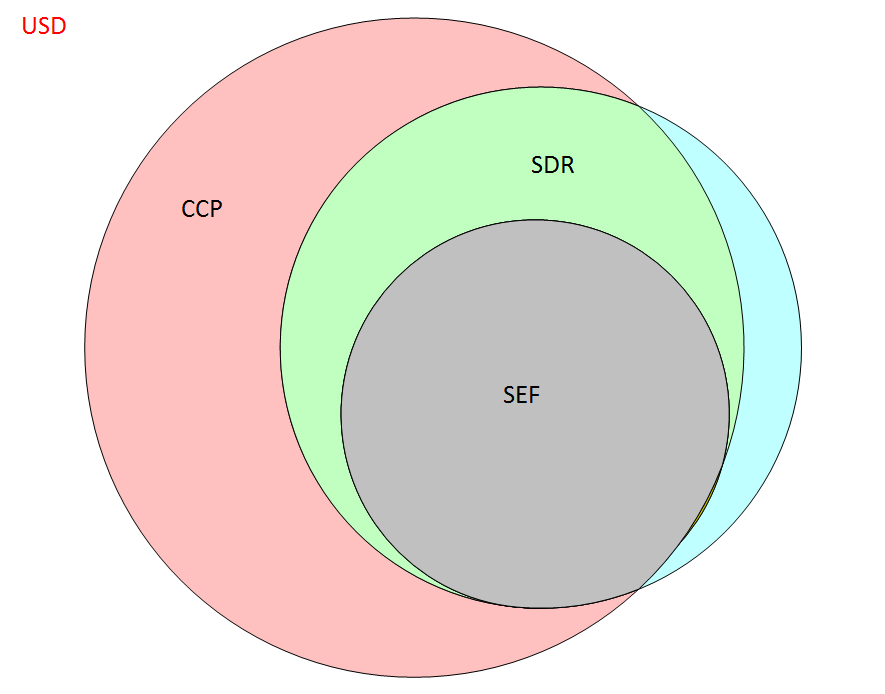
In every case, I’ve chosen just vanilla IR Fixed/Float swaps. This diagram is for USD, for May, month to date. This tells us a few things:
- A very good amount of the SDR activity is cleared. I know I said I wouldn’t use numbers, but it’s ~ 89%.
- The cleared portion of USD SDR activity accounts for over half of the global USD cleared activity, ~ 56%.
- 55% of USD SDR activity is traded On-SEF.
- Nearly 100% of SEF executed transactions are cleared. There is a tiny sliver of uncleared ~0.1%.
What does this tell me? Don’t forget that both the SDR data and SEF data is data that pre-Dodd Frank, we never would have seen. Also remember that SDR data is trade/price/size level information.
Having nearly 90% of the US-named market in USD swaps cleared is quite a success. Not to mention over half of the US-named swap market trading on a SEF. This is generally a testament to the success of CFTC’s swap reporting rules.
Let’s move on to EUR, this time with no words 🙂
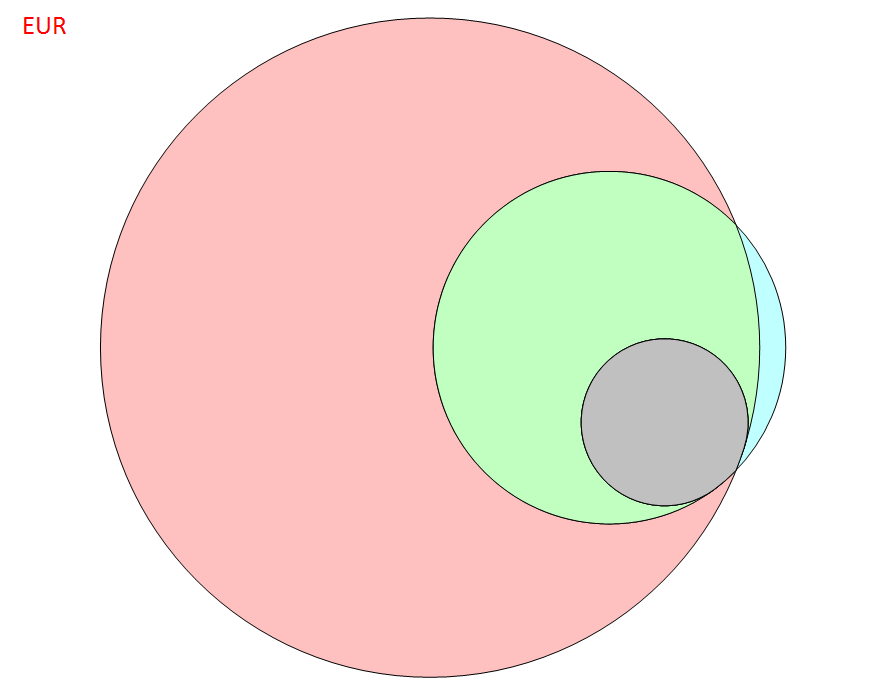
Clearly there exists a massive cleared EUR swap market outside of America, and the SEF component of the EUR market in America is an even much smaller portion. The lack of size of the grey circle (EUR SEF activity) raises some curiosity. Are the MAT requirements for EUR too narrow?
I also would think the cleared universe for EUR will expand as EMIR takes full effect. The green SDR circle seems strangely large in proportion.
Now JPY:
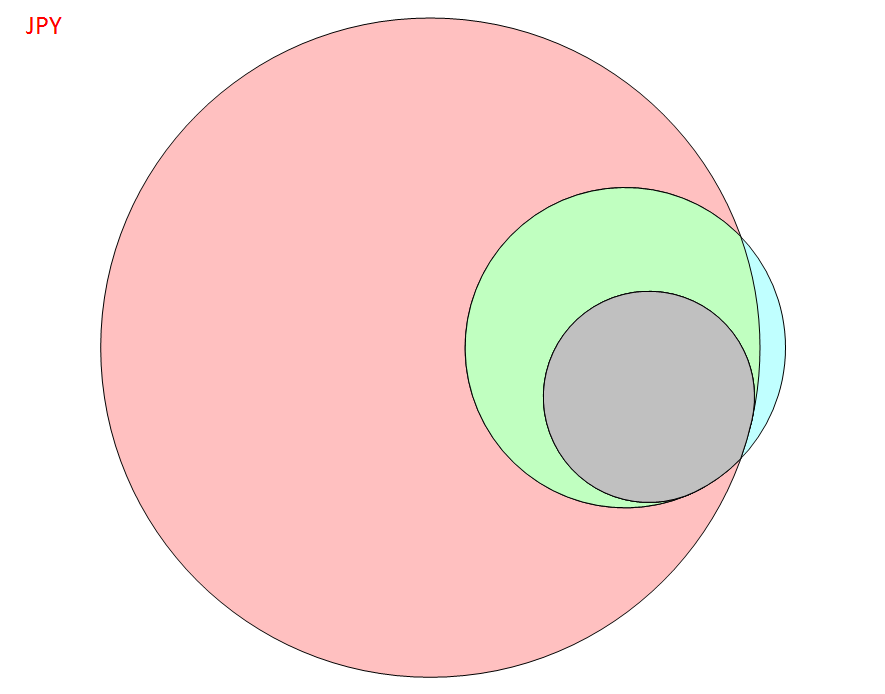
The JPY SEF circle is fairly larger, certainly larger than EUR’s. Are Japanese firms simply more keen to comply?
And finally GBP:
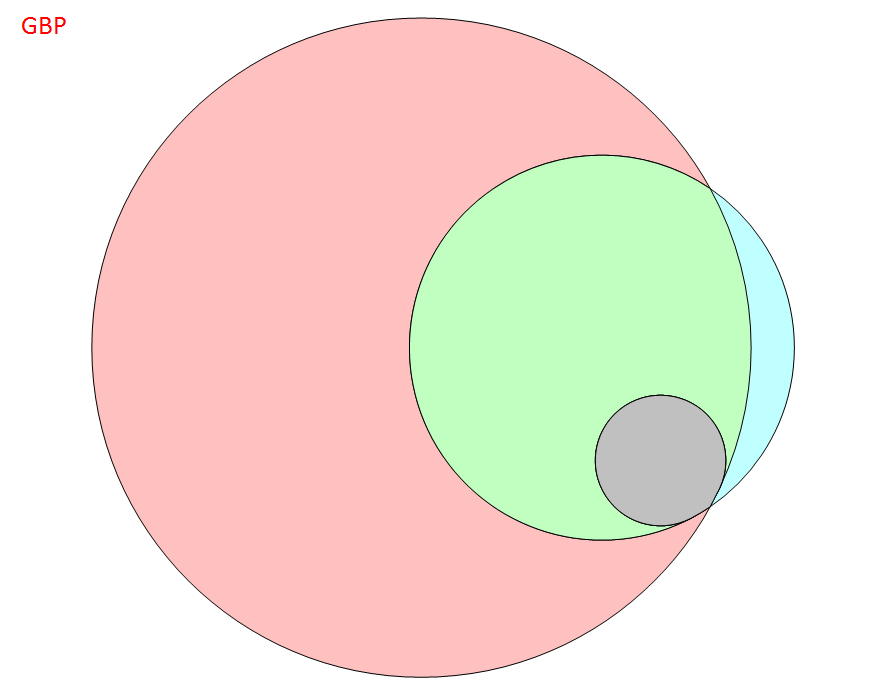
Probably the smallest on-SEF portion of them all.
Time
I began looking at this data over time to see how this grew, and long story short, at least in recent history (2015), the picture does not change much. Clearly there would have been a time when the two smaller circles didn’t exist.
Takeaways
- Sometimes people look at a set of data and do not understand the universe they are working with
- Healthy amount of US swaps business is cleared
- On-SEF % still in that 50-60% neighborhood for USD IR swaps
- EUR, GBP, JPY, much less so.
A note on Venn diagrams
I set out to make this diagram based on a few questions I had received over the past many months. I was quite surprised that there did not exist a good function / charting tool in Excel that would do this for me (at least to precise scale). I am told that MATLAB has such a feature, but I stumbled upon a free tool provided by the US government (Department of Energy) that generated these (see reference below). While perhaps not the prettiest, it seemed to do the trick quite well. Alas we have made a new page on our website to describe this data universe, however I took the liberty to scale the picture on that page myself in excel, which means its not as accurate as these!
Portions of this research were supported by the W.R. Wiley Environmental Molecular Science Laboratory, a national scientific user facility sponsored by the U.S. Department of Energy’s Office of Biological and Environmental Research and located at PNNL. PNNL is operated by Battelle Memorial Institute for the U.S. Department of Energy under contract DE-AC05-76RL0 1830.