We hear a lot about how much notional is outstanding in OTC Derivatives, and the industry efforts to reduce this burden. We’ve written before about compression and compaction, and what the exact economic and operational benefits are. Now, we can look across the Clarus product suite and augment the data to identify which trades done on-SEF are linked to compression activity.
Why do we care about these activities?
In a nutshell;
- Compression and Compaction have, on the whole, different economic drivers to a new swap.
- As a result of margin efficiency, line-item reductions and operational benefits that are inherent to the process, counterparties may be less price sensitive at the point of execution.
- Some of the packages being traded are analogous to portfolio maintenance operations such as FRA volume-matching sessions.
- The packages tend to therefore be “liquidity neutral” and provide less meaningful price information.
Overall, what I am trying to highlight is that if I have a $3bn 5 year swap to execute, my pre-trade analysis of liquidity does not want to include the 100+ swaps that were concurrently executed yesterday with a gross PV of $350m. The vagaries of margin funding, collateral optimisation and line-item charges mean that the price discovery process for these two types of execution are separate beasts. Particularly if you have a margin-optimisation tool like CHARM at your disposal!
Onto the data…
Compression in SEFView
First off, in terms of compression measurement, it’s important to realise that there are some “low hanging fruit” out there. In SEFView, the daily data from both BSEF and TrueEx are already augmented with a mark-up that identifies whether the trade volume is related to Termination or Compression activity. This is accessible by simply exporting the data into Excel. For these two SEFs, we can see sizeable activity during the month of November:
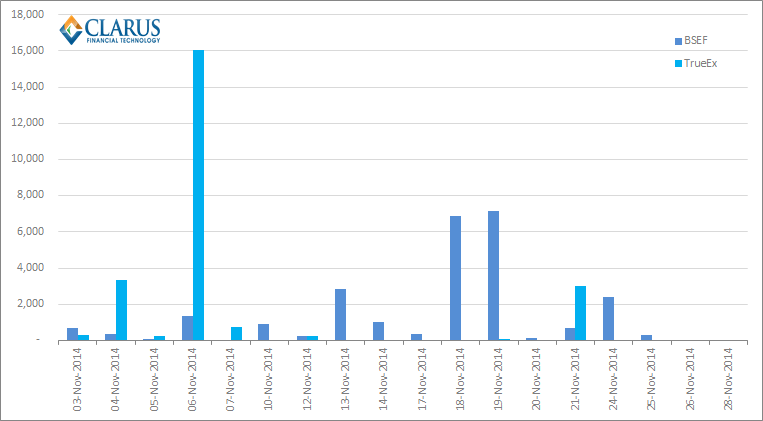
Using the above chart and the overall data from SEFView, we can see:
- Both SEF’s have compressed around $25bn during the month.
- Compression activity represented 92.4% of all USD Swap activity across the TrueEx SEF.
- Compression activity represented just 8.1% of USD Swaps traded on BSEF.
Clearly, Compression is keeping the market’s attention and is a significant part of volumes traded. However, not all SEF’s are breaking out their (public) volumes in terms of compression/termination activity versus vanilla trading. Luckily, we can turn to the SDR data to fill-in some gaps.
Compression in SDRView
The trades reported as part of a compression run have particular hallmarks that we can search for within the SDR data. Once again, this is where the power of the Clarus API comes into play. As Amir highlighted in his first blog, we can manually search for the seasoned swaps in SDRView Pro and find packages that match the reported compression activity from these two SEFs. However, I prefer to turn the analysis on its’ head and ask a slightly different question. If I search for trades in the SDR with the hallmarks of compression activity, does my search find the trades reported by BSEF and TrueEx?
Obviously, I wouldn’t be writing this blog if the answer were a resounding “No”! However, this approach turned up a very interesting facet of the data. Namely, any swap being reported to the Bloomberg SDR does not include fee information. Given this is a key economic component of compression (and MAC swaps), this is more than a little surprising. For the purposes of the subsequent analysis, we therefore exclude any trades done on BSEF.
In terms of identifying compression activity reported to the DTCC SDR, market participants will be unsurprised to hear that the TrueEx numbers are just a (small) percentage of what is actually being compressed.
For the month of November, the following notional amounts have been identified as belonging to compression runs:
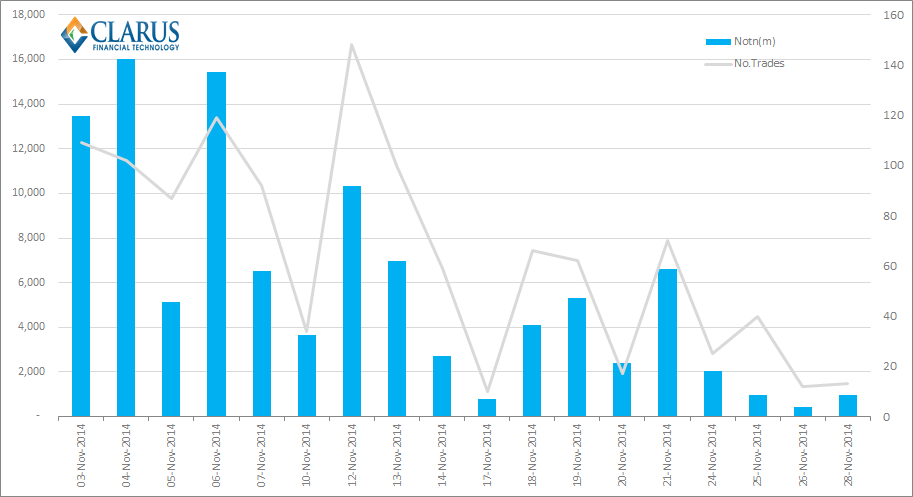
From which we can see:
- A total of 1,165 trades were identified as compression.
- These trades represented $103.9bn in notional.
- This is equivalent to 13.1% of all trades reported by number, or 13.8% by notional value.
Additionally, from the SDRView Pro API we can see that:
- $64.5m in DV01 was compressed
- A gross amount of $1.92bn in NPV was exchanged between counterparties!
It is unsurprising to see how variable the amount of compression is day-by-day. Plotting the percentage of DV01 per day that is allocated to compression gives a very volatile time-series for November:
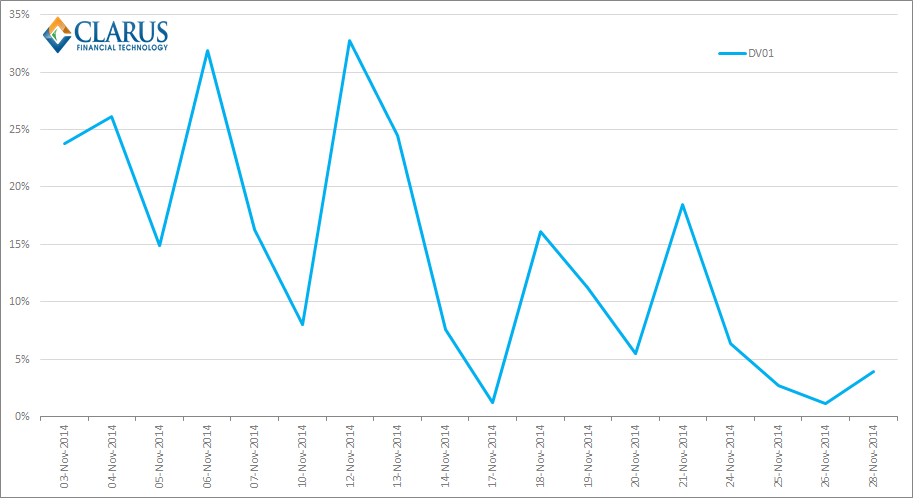
On some days up to 33% of “volumes” on-SEF are due to compression activity. A remarkable achievement for a process that was non-existent pre-SEF.
Combining the Numbers
We are currently aware of only three SEFs offering Compression runs – TrueEx, BSEF and TradeWeb. We can therefore make a (good?) estimation of how much compression each SEF is currently performing.
- We have identified $103.9bn in compression activity reported to the DTCC SDR
- TrueEx reported $23.9bn in compression for November, equal to 92.4% of their volumes.
- Therefore, TradeWeb conducted at least $80bn in compression. This is equivalent to over 33% of their volumes.
- Bloomberg reported $25bn in compression, equal to 8.1% of their volumes. The take-up of their service therefore appears to be lagging that of TradeWeb.
But…..
It’s never quite as simple as that! The eagle-eyed amongst our readers will have spotted that there are small differences between the two data-sets referred to above. For example, TrueEx reported $16.05bn in compression on 6th November, whilst my SDR-analysis yields slightly less – at $15.45bn.
Therefore, as part of the reconciliation process for the above numbers, I individually identified which swaps in the SDR data can be attributed to TrueEx compression. Taking the 4th November as an example, what we see is enlightening:
- TrueEx reported $3.32bn in compression across 1y, 2y and 3y maturities
- I can identify these trades in the SDR data…..and they total $2.194bn across 8 trades with identical timestamps
- These rather large notionals and small numbers of trades should be ringing alarm bells….
Of course, the missing link is activity linked to block trades. Of the 8 trades in the SDR, 3 are capped at the reporting limit for their respective maturities. TrueEx report their total volumes traded, including the full size of the block trades.
(As a bit of an aside, TrueEx actually assigns all of this activity to “non-Block” but the DTCC shows amounts only up to a reporting limit. My hunch is that DTCC look at the total maturity of the trade from the original start date, whilst TrueEx are looking at the remaining maturity, and hence they are employing different caps).
A Work in Progress
Nevertheless, we can assign a very good estimate across the DTCC SDR data of which trades are being reported as a result of compression activity. We can therefore create a baseline amount for how much compression activity is being conducted across each SEF. Whilst we have accurate numbers for BSEF and TrueEx, our initial cut of the data suggests over 33% of USD swap volumes done on TradeWeb are down to compression.
Over the coming weeks we will continue to refine this tool to more accurately identify compression activity. As we highlighted at the outset, it is important to be able to identify these trades because their information-content regarding liquidity and price can differ from a standalone trade. Feel free to engage with us as we continue to explore this area of the market.