SEF data continues to churn out. We’ve got a couple weeks yet until we see a few potentially interesting events unfold:
- Packaged Trade exemption runs out
- ICAP’s attempt to de-bifurcate (if that’s a word) liquidity in the swaps market with IGDL
- Bloomberg turns on their Bloomberg SDR
I’ll reserve comment on these until get closer to these events happening. Until then, we have some quiet time to investigate a few things.
DATA
Lets look at the past 4 weeks of data:
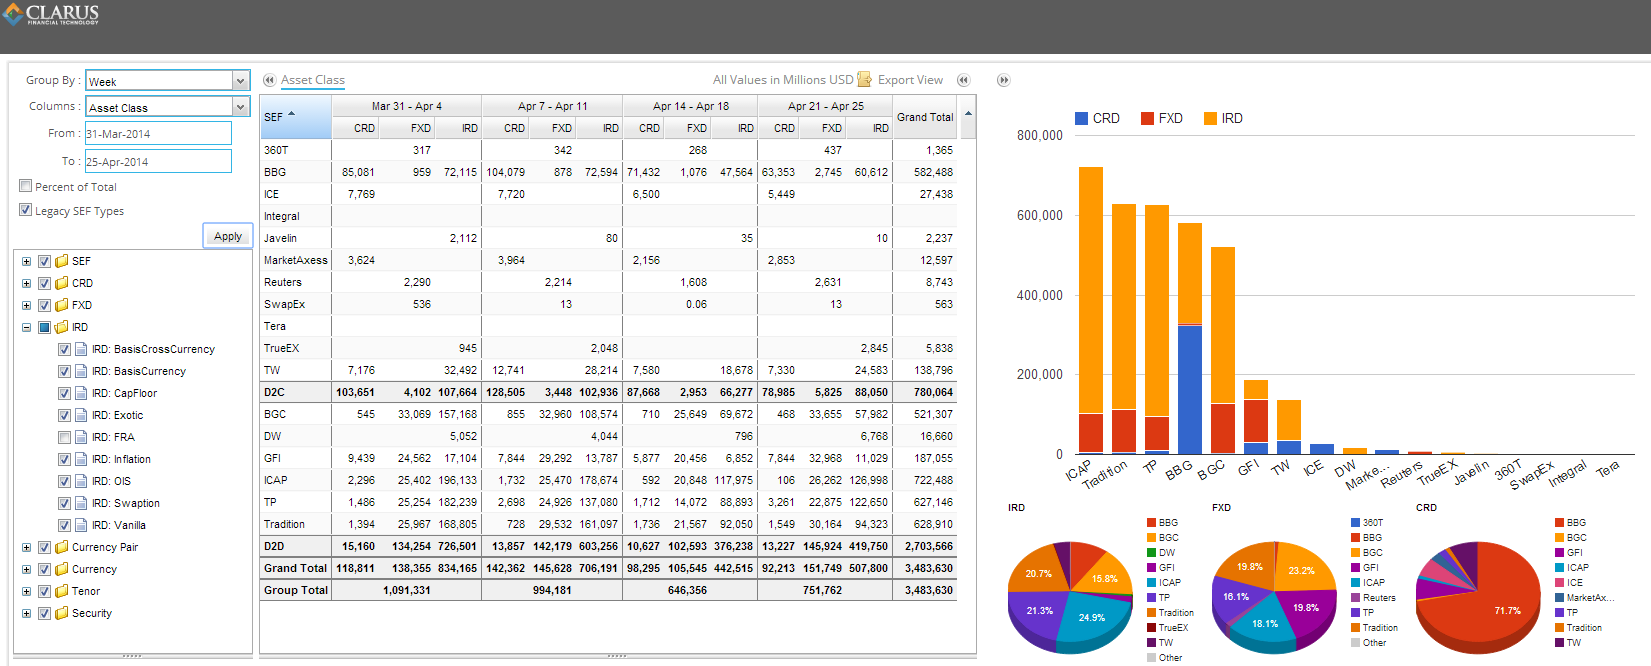
Feel free to look yourself at the most recent 5 days of history by perusing SEFView.
SOMETHING WE’RE LOOKING AT
Subscribers to SEFView know that we’ve been working on risk-adjusting these figures. The hope is that this will:
- Give a more accurate view of risk size put through each SEF
- Equalize the playing field
- As many SEF’s generate brokerage on DV01 (in some manner), give some insight into possible fees
- Allow us to stop negating FRA’s in much of the volume data, as short-dated instruments will naturally be adjusted down
My colleague Amir looked at risk-weighted activity in his blog a month ago. I thought today I’d share some of the caveats that will need to be exercised when viewing such data.
A BUTTERFLY
Most rates strategies are delta neutral spreads or butterflies. The SEFView graphic below looks at three lines of SEF data from Javelin, in what we can determine is a 4/5/6 butterfly:
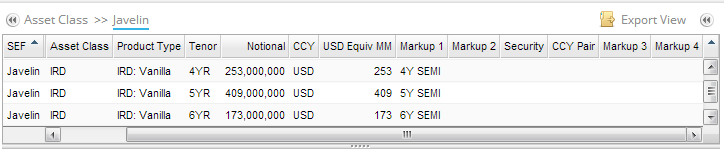
The notional of this strategy comes to a fairly hefty 835 million dollars. Sound large? Lets look at what this really means, in risk terms.
A RISKY BUTTERFLY?
I chose to key these three trades into our CHARM service to dig deeper. I keyed in 3 par rate swaps:
- 253mm, 4YR Payer
- 409mm, 5YR Receiver
- 173mm, 6YR Payer
Each trade struck at market rates, so the market value of each leg, and hence of the entire strategy, is zero.
The most fundamental perspective of a interest rate portfolio is interest rate delta. So looking at a delta ladder:
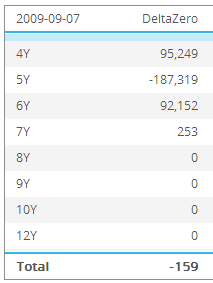
We can see that we have significant 4Y, 5Y, and 6Y delta, as expected. And forgiving some small noise, we can see that indeed the overall delta of the strategy is near zero ($159). Any parallel move in rates across these tenors, and this strategy is not terribly sensitive.
A COSTLY BUTTERFLY?
So because the strategy is DV01 neutral, does that mean initial margins on this strategy are also near zero?
Again using CHARM, we stress this position with market data scenarios. These can be “extreme but plausible” scenarios such as those recommended by the BIS for non-centrally cleared derivatives, or historical scenarios such as those employed by most clearing houses.
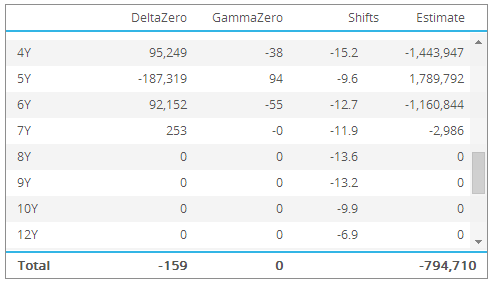
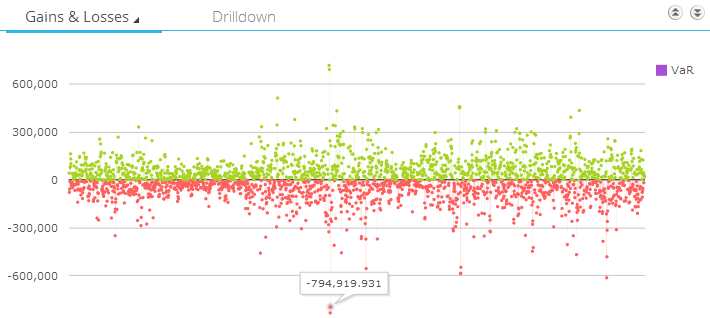
In the graphic above, I drill into one of a few thousand market data scenarios. This “kinking” of the yield curve across the 4, 5 and 6 year (-15, -9 & -12 basis points) is certainly plausible, and gives rise to a loss of $794,710. Hence under this scenario, we can see that indeed this trade can be risky. If this is one of the scenarios that give rise to a loss within the 99% confidence level (or whichever methodology being deployed), it will contribute to the required initial margin.
Looking at all scenarios on a Gain/Loss scatter diagram, we can see this scenario is the second largest loss in the simulation. Most margin methodologies will then look to take a particular scenario result (such as this one), or average of some number scenarios within the confidence level. Whatever the methodology, it is safe to say that this strategy, while “delta neutral”, will indeed give rise to a significant margin.
WHAT DOES THIS HAVE TO DO WITH ANALYZING SEF DATA
As with any data, you have to interpret what you are looking at. I think there are a few things to realize:
- SEF’s are reporting butterflies (delta neutral strategies) as individual legs
- As stated by many more intelligent people before me, this tends to gross up the “notional” metrics in the OTC world, and the SEF world is no different
- Whatever your beliefs are on how SEF’s charge brokerage, you’ll need to need to be careful when looking at gross notionals and even gross deltas
- The world of non-cleared margins is going to be fun! (OK, this has nothing to do with SEFs)
We’ll keep plugging away in anticipation of exciting times ahead.