Very occasionally, the data writes a blog for me. This is one of those times, with three particular highlights:
- Volumes of €STR futures continue to increase:
- Open Interest is now ~$120bn equivalent, up from ~$50bn at the beginning of the year.
- ADVs have skyrocketed to $180bn in March 2024, up from $80bn in Feb.
- Open Interest at both ICE and CME is now over $50bn, with ICE just pipping CME in recent days.
- Eurex have had their largest days ever in €STR volumes recently, with two days over $200bn.
€STR Futures
I have slightly tweaked our €STR Dashboard, which summarises key liquidity attributes in this growing market:
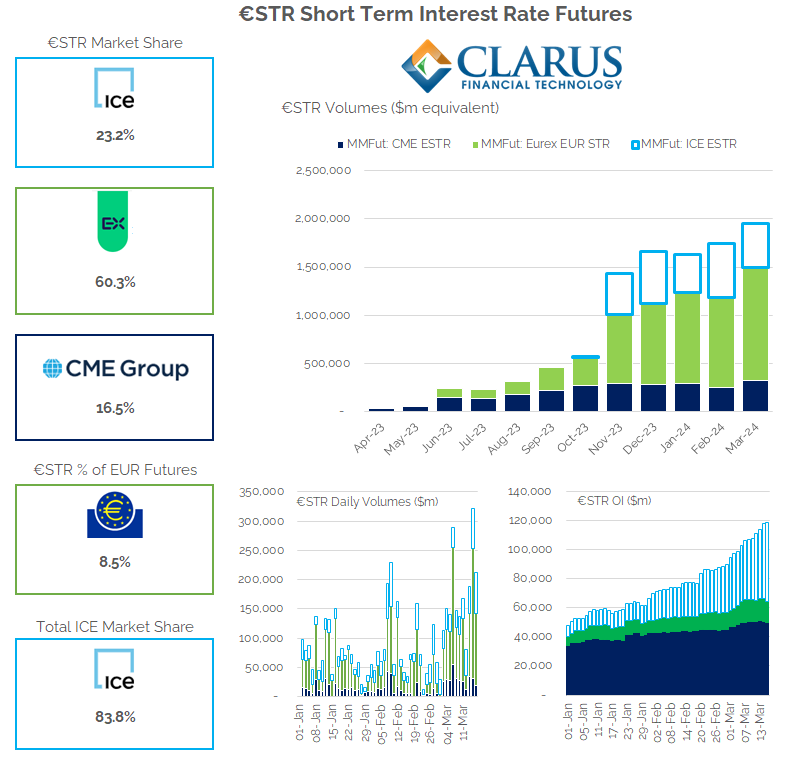
Showing;
- Volumes traded in €STR futures are making records in March 2024.
- The data above is up to and including Friday 15th March – volumes are already significantly higher than during any previous month.
- The Eurex market share has jumped to 60% by volumes traded.
- CME have seen a steady $50bn OI and the ICE Open Interest has grown quickly this year to now stand at $54bn.
- There have been some really large volume days at Eurex in €STR futures, helping drive a couple of days above $250bn equivalent traded.
The really large volume days at Eurex have not materially added to the Open Interest yet, where-as ICE sees a consistent growth in OI. On the other hand, CME may not have the largest daily volumes, but the OI has seen consistent growth throughout the year.
Something for everyone?
Volume traded and OI growth really differs between the three franchises. It seems like the data is giving something to everyone at the moment:
- CME can point toward a consistent franchise – and I imagine it isn’t easy to extend SOFR STIRs into other currencies.
- ICE can point toward OI growth extending the footprint of their franchise (and presumably leveraging off the strength of EURIBOR).
- Eurex can now point toward having the largest €STR market share by volume and some really huge volume days.
- All three franchises can point toward the health of the €STR futures market, with really impressive volume and OI growth throughout 2024.
And EURIBOR?
The dashboard highlights that €STR futures only make up 8.5% of total EUR STIR volumes- the rest are in EURIBOR contracts. And combining €STR and EURIBOR sees ICE as the sure-fire market leader with an 84% market share.
Eurex have continued to see growth in EURIBOR volumes recently. So it is well worth a final chart today:
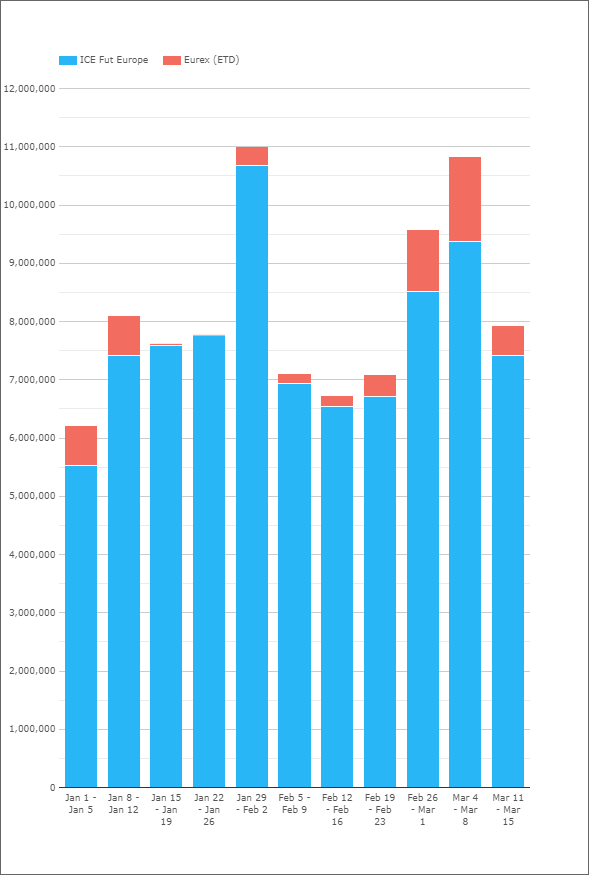
Week-on-week volumes at Eurex continue to be very volatile – with notable spikes at the beginning of January and March. One to monitor going forward, particularly with Eurex stating it will continue to be a focus for them (despite a “watered-down” or “toothless” definition of Active Accounts now being rolled out in Europe).
In Summary
- The data speaks for itself in the on-going three way battle for dominance in €STR futures.
- The Clarus API summarises the most relevant volume metrics in an €STR Liquidity Dashboard.
- The continued evolution of trading in €STR and EURIBOR products promises to be a stand-out feature of EUR rates trading in 2024.