- 60-70-40 are the three numbers you need to know for RFR Trading now.
- 60% is the percentage of global trading that takes place against RFRs.
- 70% is the amount of the USD market that trades versus SOFR.
- 40% is the maximum amount of the EUR market that trades versus €STR.
We have had a number of people reach out and ask when the RFR Adoption Indicator will next be updated. It is a great vindication of all of the hard work that has gone on over the past 4 years (and even longer when you consider the wider work on LIBOR cessation, Fallbacks and Benchmark reform, beginning way back in 2017). It also leaves me wondering what a whole host of project people are now doing across the industry!
The monthly process to update the RFR Adoption Indicator was relatively in-depth because it was built from the bottom-up. We defined the exact products we wanted to include (and exclude) in both the RFR and “Legacy Rates” camps.
Now we are moving to ad-hoc updates, I thought I should outline the “quick and easy” way to track RFR Adoption.
Clarus API – CCPView
Our microservices allow me to query numerous volume measures in CCPView. That means we were able to build the original RFR Adoption Indicator by defining (lengthy) product lists and pull in the volumes and DV01s traded.
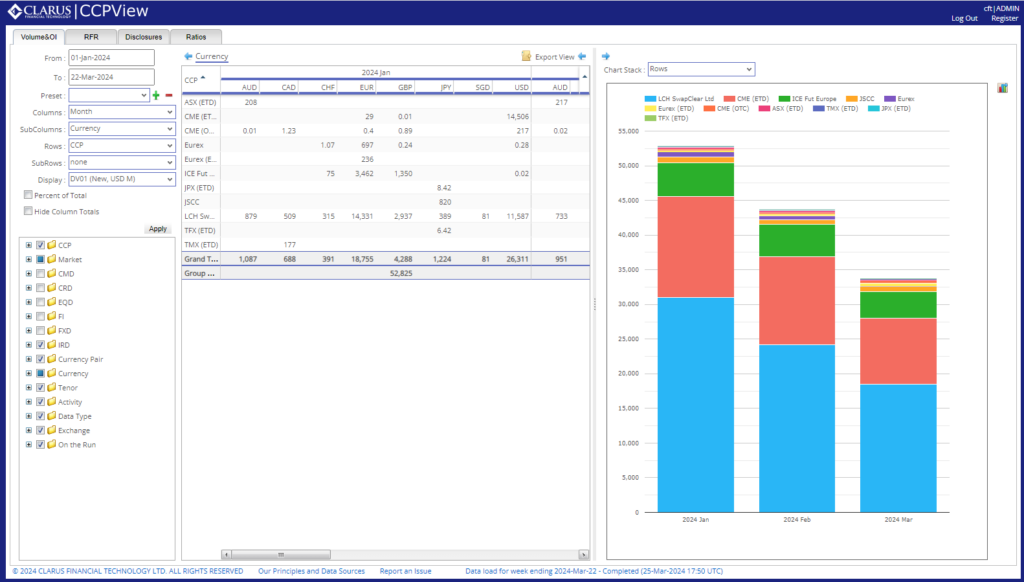
Now, there is a better/different/quicker way. It is not quite as accurate – mainly because it, by default, includes ALL products. Therefore, when a new product is launched – e.g. CME T-Bill futures – the composition of the indicator may change over time.
But I can monitor RFR Adoption across 8 currencies (and the total) using just two API queries. Which is pretty cool.
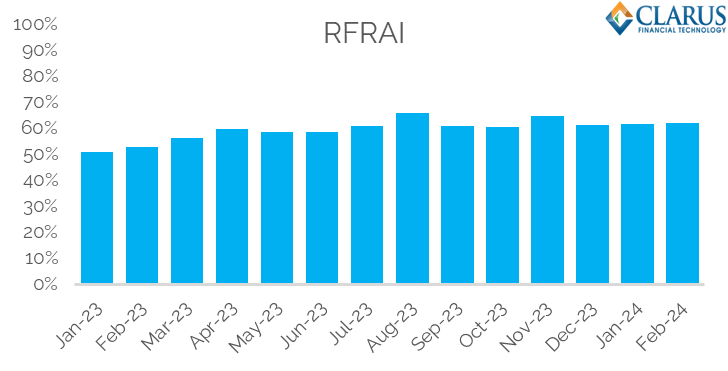
RFR Adoption in 2024
The chart for the past year highlights that the end of 2023 was probably the right time to cease regular publication of the Adoption Indicator:
Showing;
- As of February 2024, the RFR Adoption Indicator stands at 62.3%.
- It has been between 60.6% and 66.2% since July 2023.
- There is no particular pattern to the monthly variations.
- The past three readings have been particularly static – 61.3%, 61.7%, 62.3%.
There remains volatility when monitoring each individual currency:
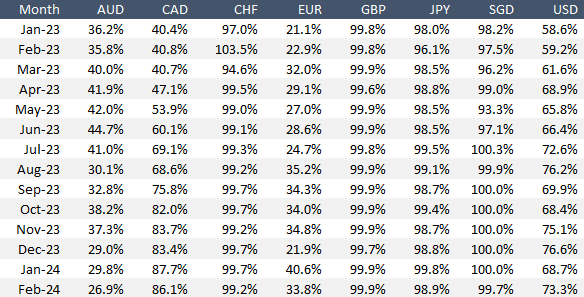
Showing;
- It is really overkill to state these to one decimal point, but old habits die hard!
- EUR sees the most variable uptake of RFR trading in any given month.
- €STR has ranged from 21.9% to 40.6% of activity in the past three months alone.
- This is against a backdrop of an on-going market share battle in €STR futures, and hence the data is of particular interest.
- Looking at USD, SOFR has made up anywhere between 68% and 76% of trading.
- The rest of the USD risk is traded versus Fed Funds. The split between SOFR and Fed Funds has tended to oscillate month-on-month.
- CAD CDOR is fast approaching cessation. Usage of CORRA has plateaued somewhat in the 82-87% range, but that is entirely consistent with our experience of other currencies running up to a cessation date.
- In fact, I would say that CORRA adoption is doing very well indeed.
In summary, I am trying to highlight that there isn’t really a single data point that jumps out here – hence I haven’t blogged on it as a standalone topic. RFR Adoption feels a little bit like yesterday’s news from these figures.
What Is New..
..is how I run these figures. Using just two queries, I have a succinct overview of market activity in all of these currencies:
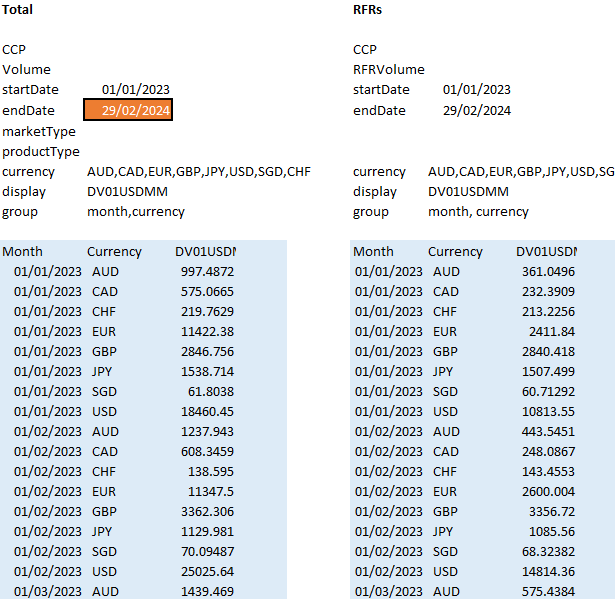
- The API returns total DV01 traded across all eight currencies.
- And in a second call, the API returns the total RFR-linked DV01 across all 8 currencies.
Take (2) from (1) and you have all the ingredients that you need for the RFR Adoption Indicator. We tend to talk about the variability in percentage terms, because we can relate to that. But note that this also gives us the absolute amounts of DV01 traded each currency – giving a quick summary of how active markets have been (and split per currency).
In Summary
- RFR Adoption is pretty static, accounting for about 60% of global trading.
- It is most volatile in EUR, where there is no mandate to trade RFRs. It varies anywhere from 20-40%.
- EUR will continue to be interesting given the on-going market share battle in €STR futures.
- USD varies month-on-month (around 70%) as the percentage of risk traded versus Fed Funds is reactive to changes in monetary policy expectations.
- CAD is progressing very nicely toward CDOR cessation in June, with over 85% of risk now trading versus CORRA.