- The FRTB Internal Model Approach requires risk factors to be checked for modellability
- Non-modellable risk factors are then subject to stressed capital add-ons
- Modellable and non-modellable is determined by applying a specific test
- Clarus has the Data and Analytics to perform such a test
- We make this available in our FRTB for Excel product
- Making it easy to check for modellability / non-modellability
FRTB Modellable test
The specific test is for continuously available real prices and is defined as follows:
- a risk factor must have at least 24 observable real prices per year
- with a maximum period of one month between two consecutive observations
- the above criteria must be assessed on a monthly basis
- and measured over the current ES period (e.g. past 12 months)
For further details, see FRTB – Modellable Risk Factors and Non-Modellable.
[UPDATE: January 2019, this criteria has been revised, see FRTB RFET.]
Excel Workbook
Lets take a look at the FRTB for Excel workbook.
On opening the Get Started sheet is shown.
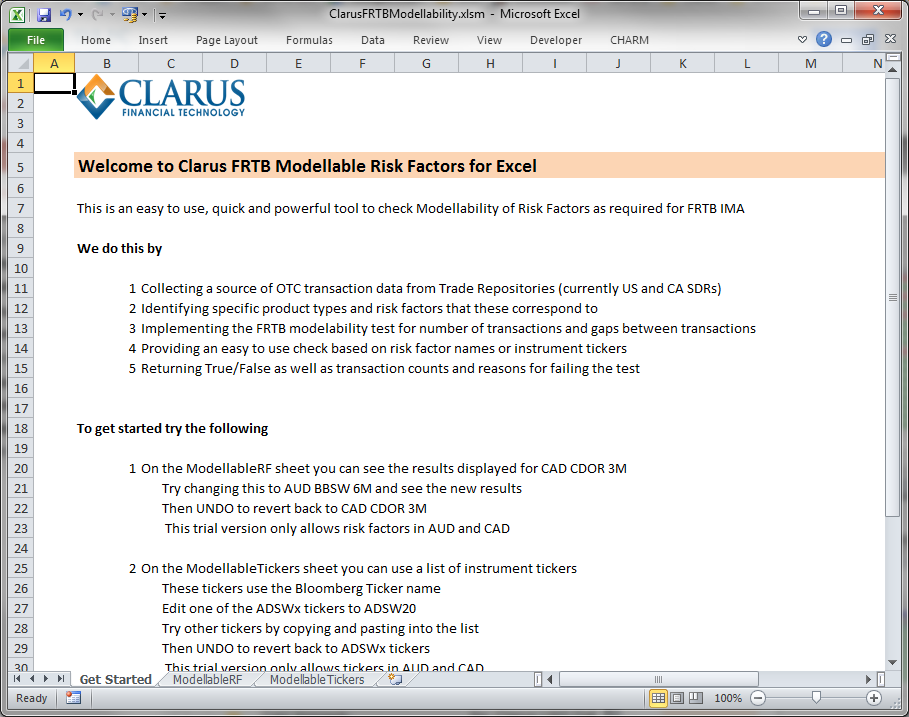
Explaining how to use the functionality in the workbook, by suggesting a few simple edits.
Risk Factor / Curve Name
For Interest Rates, the first thing we want to know is for a Swap Curve used in our IMA, which points pass the modellable test and which do not.
To do so, we simply need to enter the currency, index and tenor e.g. CAD CDOR 3M (as shown below).
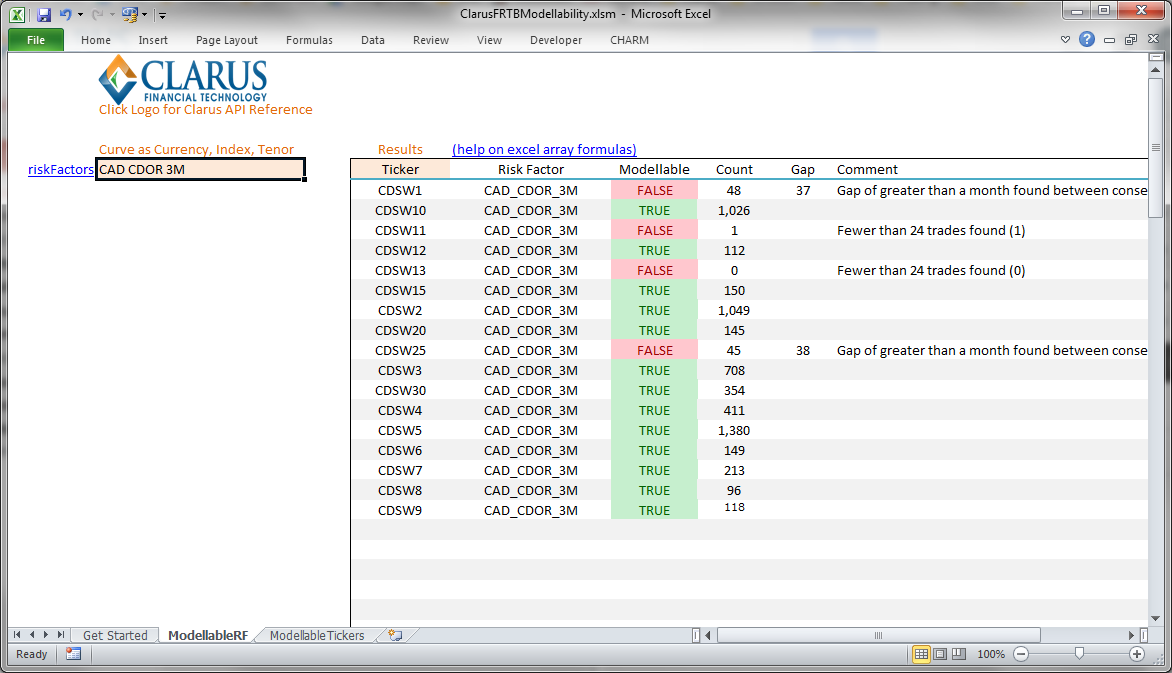
Showing:
- A list of Swaps identified by their Bloomberg Ticker
- Green for Modellable and Red for Non-modellable
- 1Y, 11Y, 13Y, 25Y fail the test
- And a comment explains the reason for the failure
- 2Y, 3Y, 4Y, 5Y, 6Y, 7Y, 8Y, 9Y, 10Y, 12Y, 15Y, 20Y, 30Y pass the test
- Meaning we could use all these in our IMA, safe in the knowledge that they are modellable
- And we would not be subject to an expensive stressed capital add-on
Next we could repeat this for another index-tenor in CAD or for another currency.
Risk Factor / Ticker
For more control, it is also possible to pass a list of specific tickers; as below for AUD Swaps.
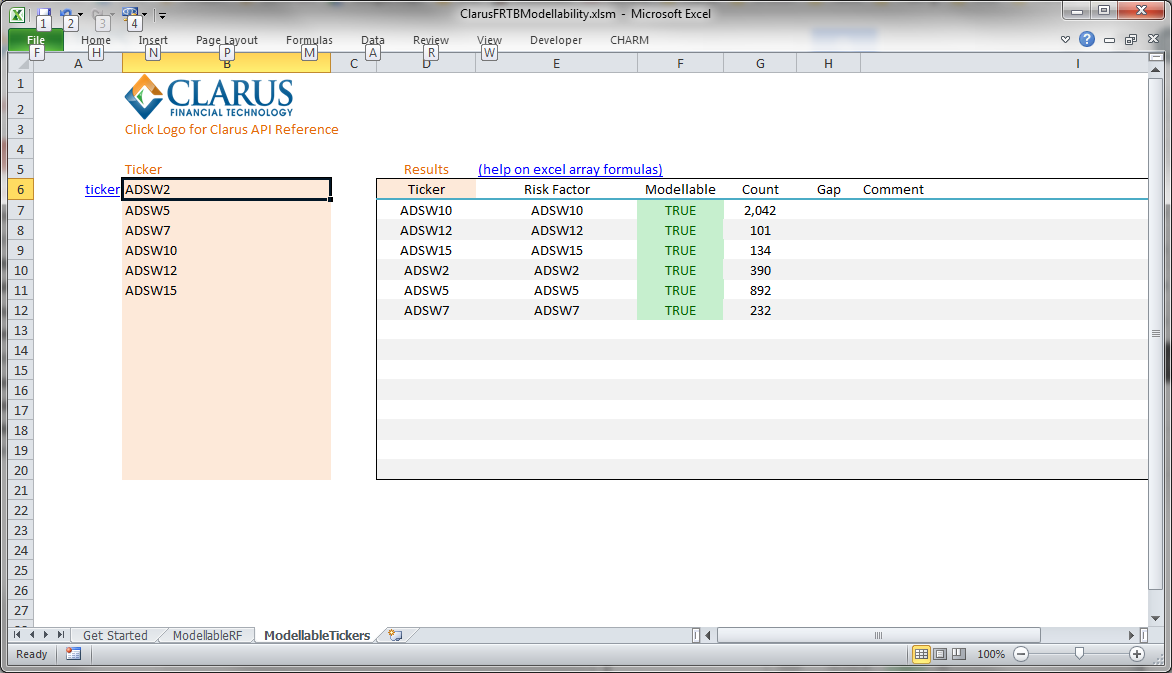
Showing that each of AUD 2Y, 5Y, 7Y, 10Y, 12Y, 15Y pass the modellable test.
Super easy to use.
Automating the test
To run this test weekly or monthly, we could use macros to automate the Excel workbook.
Or use the Clarus Microservices API and write a script in Python, R or Julia.
See my article Microservices: FRTB Modellable Risk Factors on how to do this.
Thats all.
Invitation to Try
We offer a free 14 day trial of FRTB for Excel.
If FRTB IMA is applicable to you, please try it out.
And give us feedback.
Who knows, it could save you a lot of expense and capital.