Last week I looked at Brexit – The Impact on Swap Margin and stated that we will start to see increases in Initial Margin particularly for GBP Swaps. Now that a week has passed lets look at the what the data shows.
Cleared IRS 10Y
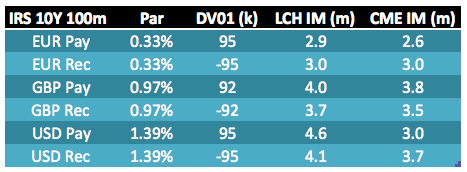
Lets start by using CHARM to calculate the IM of 10Y par vanilla swaps in EUR, GBP and USD on 4 July.
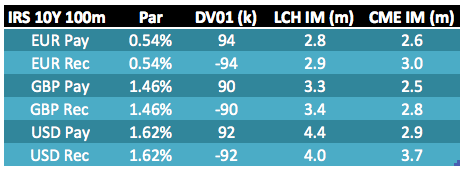
The same table but for 23 June.
And the changes.
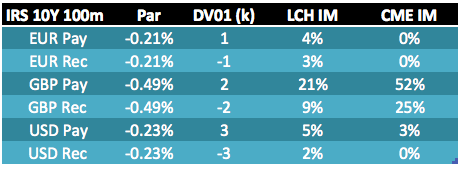
Showing that:
- EUR rates -21 bps, GBP -49 bps and USD -23 bps
- DV01 a touch higher (as rates are lower)
- Increases in IM
- GBP Pay fixed 21% higher at LCH and 52% at CME
- GBP Rec fixed 9% higher at LCH and 25% at CME
Lets look into why this is the case for both CCPs.
GBP Swap Prices
First lets construct a price history of GBP 10Y IRS and determine the 1-day and 5-day return scenarios.
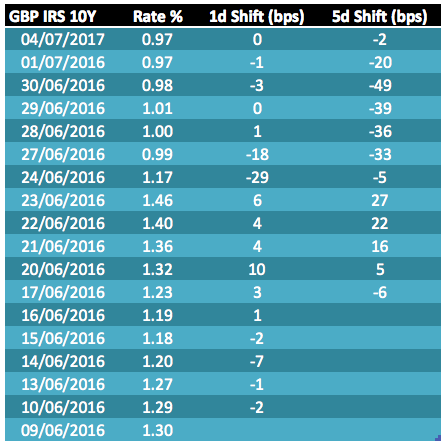
Showing very large 5-day shocks indeed, with the 5-day starting 23-Jun and ending 30-Jun showing -49 bps.
Also it is interesting to note that because of overlapping scenarios, while there are only two large down days, there are four separate 5-day scenarios of greater than -30 bps, due to overlapping returns.
LCH Margin
Using CHARM we can look at the Tail Scenarios of the LCH PL Vector for the GBP Pay Fixed Swap.
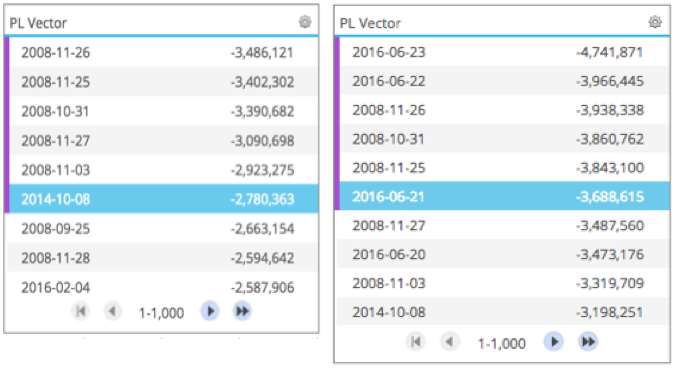
Showing on the left the Tail Scenarios as they were on 23 June and on the right as they are on 4 July.
We see that on 23 June, out of the six worst loss tail scenarios that determine IM, five are in 2008 (around the Lehman’s bankruptcy date).
While for 4 July, there are three new Jun 2016 tail loss scenarios, of which two have larger losses than the 2008 scenarios. These are the 5-day periods starting on 23-Jun and 22-Jun, which we know from the prior section had -49bps and -39bps moves.
As LCH IM uses an Expected Shortfall measure, which averages these worst six tail scenarios, and we now have two new worst loss ones in the tail, the LCH IM will clearly be higher.
There is also an additional cause as the scenario 2008-11-26 on 23-June is -3.48m, while on 4-July it is -3.93m.
We can attribute this partly to the volatility scaling of scenario shocks that is used in the IM margin model and partly to the higher DV01 on 4-Jul, at roughly a 60% to 40% ratio (using scaled shock scenarios and DV01 data from the drill-down).
Next the Tail Scenarios for the GBP Receive Fixed Swap.
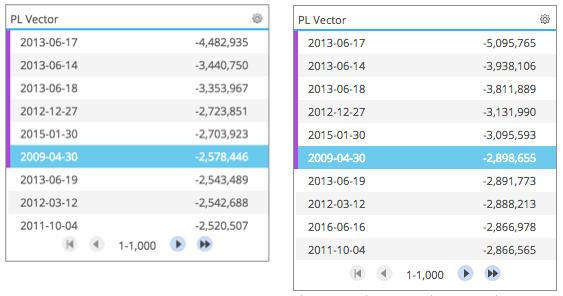
Showing on the left the Tail Scenarios as they were on 23 June and on the right as they are on 4 July.
This time we see the exact same Tail Scenario dates for both, but higher PL values for 4 July.
So the increase in IM is due to volatility scaling resulting in larger shocks applied on 4 July and the higher DV01 of a par Swap on 4 July. And without any new tail scenarios, we see a smaller increase for the Receive Fixed Swap compared to the Pay Fixed.
CME Margin
Using CHARM we can also look at the Tail Scenarios of the CME PL Vector for the GBP Pay Fixed Swap.
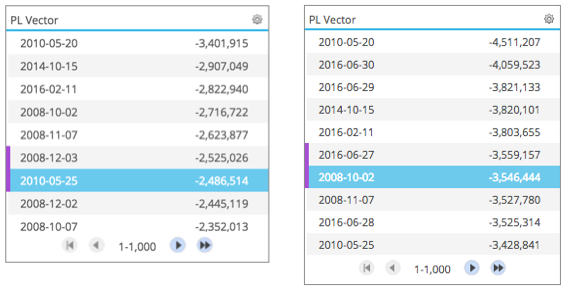
Showing on the left the Tail Scenarios as they were on 23 June and on the right as they are on 4 July.
We see that for 4 July, there are now four new June 2016 loss scenarios that are greater than the tail percentile. The worst of these is for the 5-day period ending 2016-06-30.
As CME IM uses a VAR percentile measure it is more sensitive/responsive to a change in tail scenarios than an Expected Shortfall measure.
In addition we see the same volatility scaling and higher DV01 effect that we saw with LCH; if anything this is more pronounced.
In-fact were we to drill-down to see the shocks applied on say 2010-05-20, we would see that the impact of the volatility scaling is more significant as compared to LCH.
I could repeat the above but for Receive Fixed Swaps, but you get the idea.
Comparing CME and LCH
Both LCH and CME IMs have increased significantly for GBP Swaps.
The CME increase is larger in percentage terms than LCH.
50% up for CME GBP 10Y IRS pay fixed vs 20% up for LCH pay fixed.
As CME’s methodology is more sensitive/response to volatility and tail scenarios.
This is not to say one is better than the other, as stability of risk measure is also important.
It comes down to choices made by these CCPs in terms of responsiveness and stability.
And the end result is that for a GBP 10Y IRS Pay, CME IM is £3.8m vs LCH IM of £4.0m.
While for a GBP 10Y IRS Rec, CME IM is now £3.5m vs LCH IM of £3.7m.
So both broadly similar.
Final Thoughts
Initial Margin for Cleared GBP Swaps has increased significantly.
Due to the unprecedented moves in GBP Swap Rates over the Brexit period.
With 10Y GBP IRS down 49 bps over the 5-days between 23 to 30 June.
These shocks are larger than those of Oct/Nov 2008 during the Lehman’s crisis.
Volatility scaling, Higher DV01 and New Tail Scenarios have each contributed to the increase.
Many firms maintain a Margin buffer to handle CCP margin calls.
Usually this is sized based on a maximum expected amount of VM.
Over the last week, we see that IM can also increase quickly and significantly.
Such IM changes, should also be factored into a margin buffer.
CHARM can provide insights into sizing a buffer.
For firms with GBP pay portfolios, IM will have increased by 20% at LCH.
For large UK firms, this will have required much higher amounts of cash and collateral.
Interesting article Amir.
Best practice around margin buffers – now that’s an interesting area!