aka “Is being an FCM viable?”
I was curious to see how FCM’s performed on Friday June 24th. How much cash did they have to throw at the business to sustain the market volatility on behalf of their clients?
Thankfully, I recalled coming across some FCM disclosure documents that listed out various gory details. Sure enough, CFTC rule 1.55(o) requires FCM’s to spill the beans every day in a “Daily Seg – FOCUS II” report. Apparently this is the report that, if you are in trouble, would admit such to the world. So I went and grabbed the daily reports for the top 5 FCMs, as per their March 2016 rankings here, for the past week. This meant Credit Suisse, Morgan Stanley, Citigroup, JP Morgan, and Wells Fargo, for June 20th through the 24th. I then normalized it all into a format one could readily digest.
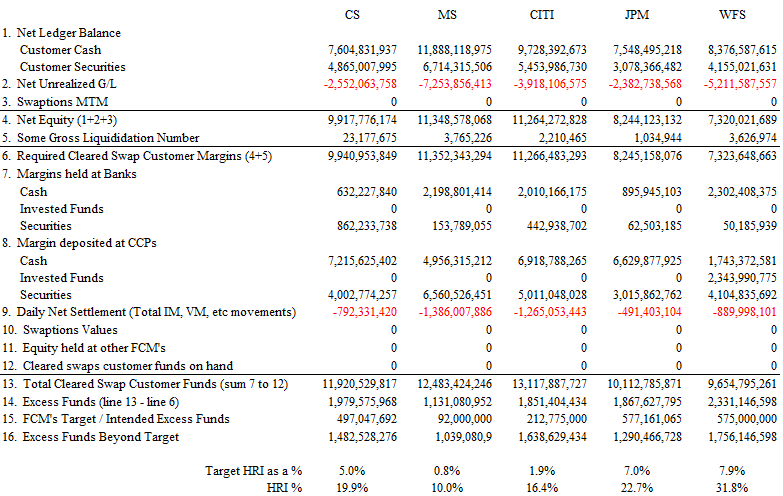
I then took a crash course in how to interpret a Daily Seg report, which I will share with you now. The table below shows the data for close of business Friday 24-June (Brexit Day). Be slightly cautious as I have renamed each section to make it a bit more sensible. And to be clear, this is just for Cleared Swaps. There are other such reports for Futures as well.
My explanation:
- (1) shows customer cash and securities pledged to the FCM (Margin to cover IM & VM)
- (2) the total gains/losses for outstanding positions (total VM)
- (3) Swaptions MTM
- (4) Net equity, so the sum of 1 through 3
- (5) I could not understand the values in here. Each day there were some +’s and –‘s so I just added them up. In the grand scheme of things, these numbers are insignificant.
- (6) Total Required Margins. It is this number that I used to rank FCM’s back in March. It reflects how much cash and securities are required to support the client business.
- (7), (8), and (11) show the amounts of cash, securities, and investments held by the FCM at various places; banks, DCOs, and other FCMs, respectively. These funds include those pledged by a client, but also supported by the FCM.
- (9) is the Net Settlement for the day. That is, the total change in IM & VM (and fiddly things like PAI, I presume) that moved to/from CCPs on the day.
- (13) is the total amount of funds held to support the business. This of course includes all your customers funds, but also the cash the FCM throws at the business to stay afloat.
- (14) equates to Total Funds (13) minus Required Funds (6). This is the number that has to be a positive number, or you go risk being slapped around / sent to jail for being “Under Seg”, which is another way of saying you don’t have enough cash to support your clients. This number is often referred to as “House Residual Interest” or just “HRI”.
- (15) is how much excess funds the FCM typically intends to have in excess as a buffer for volatile days, to cover their clients gains/losses.
- (16) How much excess funds exist, beyond the FCM target.
With the educational part of the blog out of the way, we can now interpret the numbers:
- I am surprised that total gains/losses (2) is a negative number across the board. Is this to say that all 5 FCM’s clients are collectively in negative MTM? It seems akin to looking at a Casino’s daily report for their client activity. Of course this is just swaps, so perhaps there are gains elsewhere.
- Odd, but none of these 5 seem to be clearing swaptions. Full disclosure I did look for Barclays reports, they were #6 on the rankings in March, but I couldn’t find them. I’d believe they have some numbers here.
- The majority of client funds are held at CCPs (vs at banks), which I am glad to see. I am guessing, but it would seem plausible that client funds are generally held at CCPs, while the FCM funds are held at both banks and CCPs.
- The total, net “margin calls” in line 9 range from $790m to $1.38bn. This is net don’t forget, so if Client A lost $100 and client B gained $100, this number is 0.
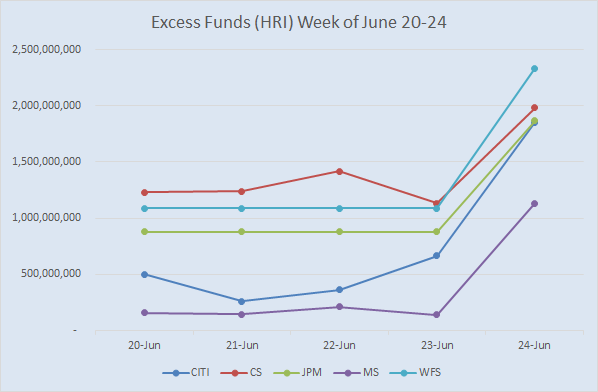
- The amount of HRI in line 14, which is the excess funds held at banks and CCP’s, ranged from $1.13bn to $2.33bn. This is the staggering number, as these figures represent how much cash is being used to support the business that is not doing anything on the day. More on this later.
- I’ve added some of my own numbers for “HRI”. Target HRI% shows how much extra cash, as a percent of required funds, that the FCM intends to keep around every day. This ranges from 0.8% to 7.9%. I liken this to your gas gauge, as when this goes to 0, you are in trouble (and under-seg).
- HRI% for close of business 24-June ranged from 10% to 32%. So lots of excess funds required to keep the business churning that day.
HRI
Let’s take a closer look at this HRI. The real story behind all this excess cash being required at an FCM seems to be twofold:
- LSOC. The FCM always has to support client losses, and cannot use other client gains to do so. So, in our example where Client A makes $100 and Client B loses $100, the FCM needs to have $100 sitting around to make good on Client B’s margin call, without effecting Client A.
- Intraday Margin Calls. CCP’s (at least one of them) perform margin calls intraday. This is a good conservative measure. However, there is a rub. If the market sells off early in the day and margin calls are triggered, the FCM has to tuck away that cash. However if the market recovers, there is no “margin refund” later in the day. Friday was a decent example of this, as the market retraced a bit over the course of the day.
Those two combined seem to explain why excess funds jumped on Friday.
It’s important to note that this is not just some accounting number, rather this represents a real funding requirement and poses real liquidity challenges. Imagine asking your boss for “an extra billion” to get through the day. “Let me just run down to the ATM”!
Here is how HRI jumped on Friday:
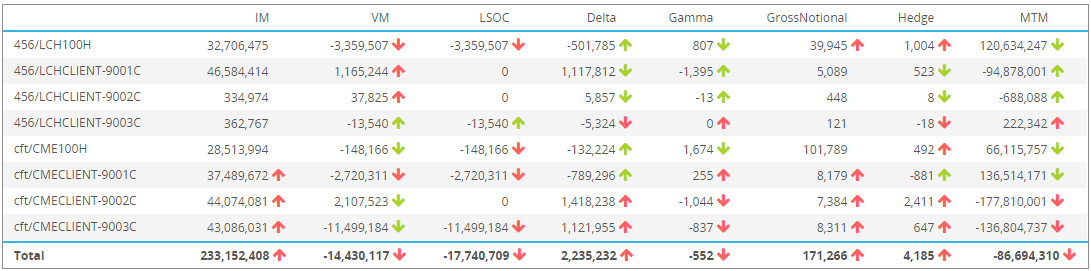
It’s for volatile days like Friday that we promote the CHARM web application to monitor expected liquidity requirements. For example this Risk dashboard with a sample FCM with 6 clients across a couple FCMs, which updates as market data changes and trades are done:
Customer Required Funds
For those who enjoyed my article on FCM Rankings, I’ll give you a little update on how the top 5 FCM’s have shaken up over the past 3 months. Full disclosure, I have limited my research to only the top 5 as ranked in March, but here is how things have shaken up since then, with Morgan Stanley now having the most Required Funds for Cleared Swaps. The “Change” is from March 31, 2106 through June 24.
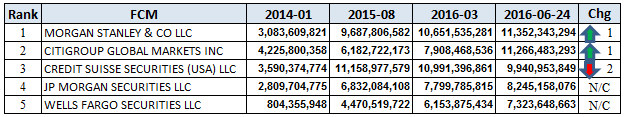
What’s intriguing is just how volatile this number is. Check out the chart below for just last week:
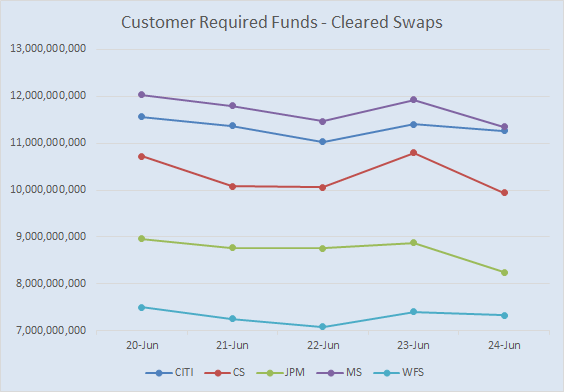
It would seem as though many positions were closed on Friday, in a couple cases representing nearly $1bn of margin reductions.
Summary
Thats all I have time for today. A brief recap:
- FCMs seemed to have survived Fridays Brexit, albeit having to raise significant funding
- HRI is the residual cash that FCMs are forced to procure to cover adverse moves, which on Friday in some cases exceeded $2bn
- Intraday margin calls and LSOC are designed to keep clients safe, but that safety is at a cost to the FCM (which in turn likely translates into fees for clients)
- Required Client Margins is a volatile number, and we seem to have a new #1 at the top of the FCM Swap leaderboard in Morgan Stanley
I’m on vacation for the next couple weeks, so will not be blogging again until later in July. Unless something catastrophic happens, like Texas voting to leave the USA. Texit!