This blog covers the 2024 edition of the “ISDA Year-End Margin Survey”, published on 14 May 2025, which covers over-the-counter (OTC) derivatives uncleared initial margin (IM) and variation margin (VM) for all asset classes, and cleared IM for interest rate derivatives (IRD) and credit derivatives (CRD) only.
We combine the ISDA survey data with more comprehensive data on central counterparty (CCP) IM disclosures from CCPView to estimate the total derivatives IM across exchange-traded derivatives (ETD), and both cleared and uncleared OTC derivatives.
Summary
Total derivatives IM at the end of 2024 was $1,375 billion with ETD causing the $37 billion growth from 2023 year-end, while both cleared and uncleared OTC derivatives IM were flat year-on-year (YoY).
It is tempting to conclude that IM is plateauing, but more ISDA margin surveys and editions of this blog are required before forming any such conclusion.
Over the long range, total derivatives IM has increased by $814 billion since the end of Q1 2017. Of this increase, only $206 billion came since the end of 2021, implying IM growth is slowing.
Background
Feel free to skip this section and refer to it later.
Our blog on 2023 total IM is here. It includes details on the ISDA SIMM recalibrations that year and several links to blogs on the same topic from earlier years, which I will not repeat here.
The phased rollout of the uncleared margin rules (UMR) ran in six phases, from the biggest banks in phase-one to the smallest, non-exempt buy-side firms in phase-six. The phase live-dates ran each September – from phase-one in 2016 to phase-six in 2022 (September 2020 was skipped because of COVID-19). The following chart from the survey covers the later years of the timeline.
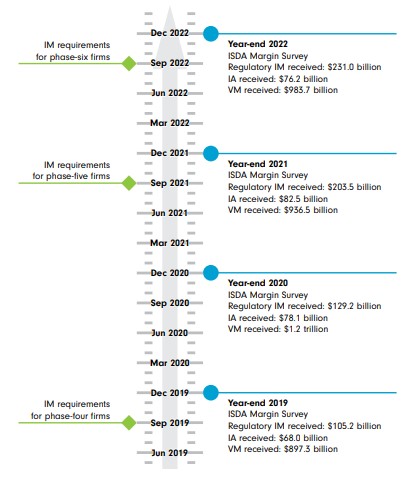
Chart 1: Later phases of UMR rollout with surveyed build-up of uncleared VM and IM. Source: 2024 ISDA margin survey.
The UMR-driven uncleared IM is termed regulatory IM (reg IM) in the survey and is also referred to as SIMM IM after the margin model mandated. Non-regulatory forms of IM, known collectively as independent amounts (IA), may also be agreed with and collected from a derivatives counterparty and are also included in the survey. Uncleared IM is the total of both types.
The list of 32 survey participants has been unchanged since the 2021 survey and includes all 20 phase-one firms, five of the six phase-two firms, and seven of the eight phase-three firms. Little direct trading happens between two buy-side firms in one of the last three phases. This means coverage of the total uncleared IM should be strong, but we have no measure of the exact coverage percentage.
I want to highlight an ISDA footnote: “some figures for 2023 have been restated to reflect updated data submitted by reporting firms”. This explains why the 2023 figures in this blog are not aligned with those in our prior blog. In fact, after checking prior surveys, we can see that all the figures back to 2017 have been revised in this edition.
Headlines from the survey
We look at a chart copied from the survey.
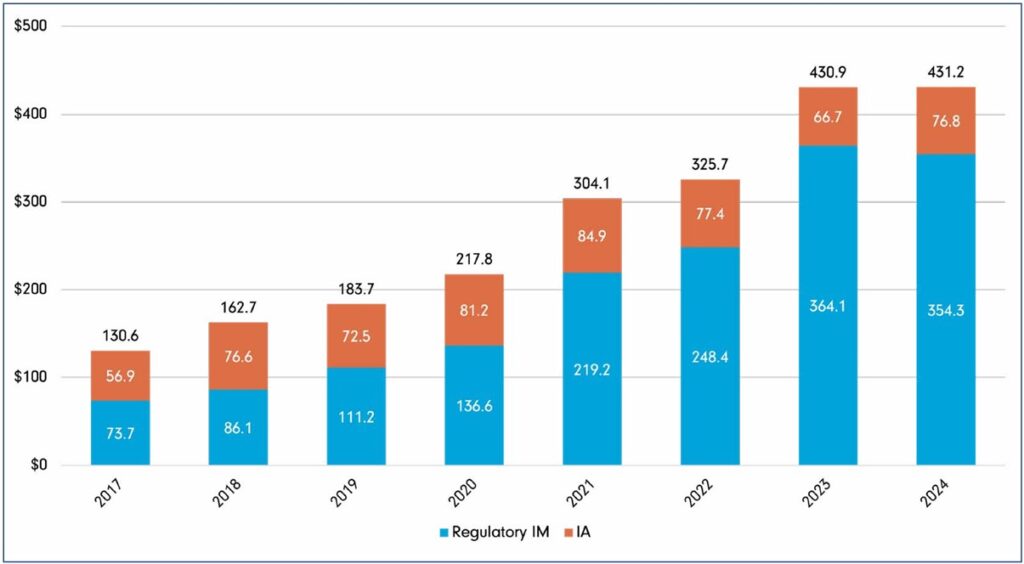
Chart 2: Uncleared IM received (USD billions) – including IA and reg IM. Source: 2024 ISDA margin survey.
Chart 2 shows that:
- After a big increase in 2023, the 32 firms surveyed collected $431.2 billion of uncleared IM (including reg IM and IA) in 2024 – flat versus 2023 (after the revisions noted earlier).
- Reg IM / SIMM IM declined for the first time by $9.8 billion (2.7 percent) to $354 billion.
- IA increased by $10.1 billion (15 percent) to $76.8 billion.
So far, the YoY dynamic is flat.
Cleared derivatives IM
For cleared derivatives, the survey presents a subset of the IOSCO-required CCP disclosures, limited to OTC derivatives IM for rates and credit only.
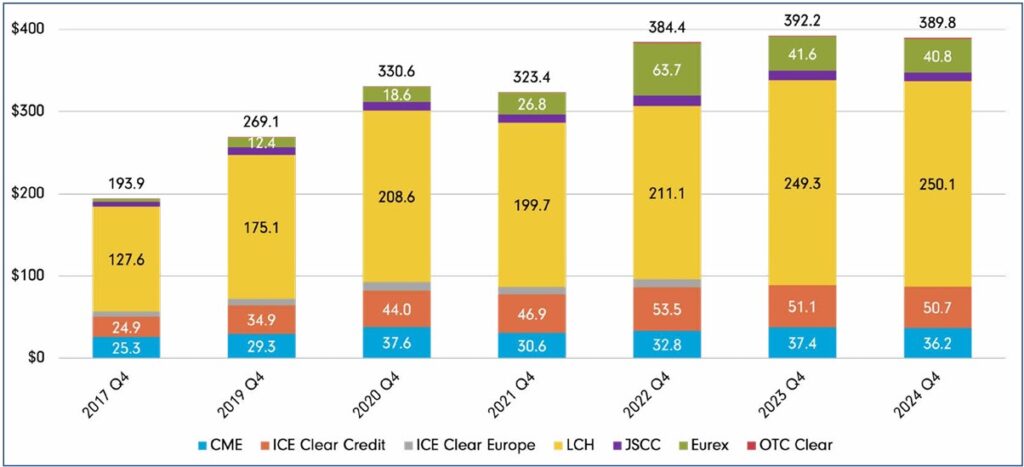
Chart 3: Required IM for cleared IRD and CDS (USD billions). Source: 2024 ISDA margin survey.
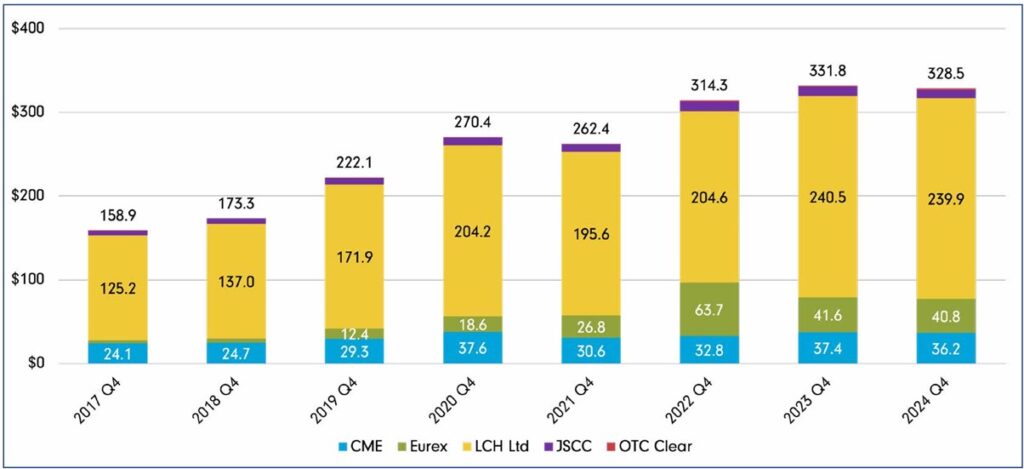
Chart 4: Required IM posted for cleared IRD (USD billions). Source: 2024 ISDA margin survey.
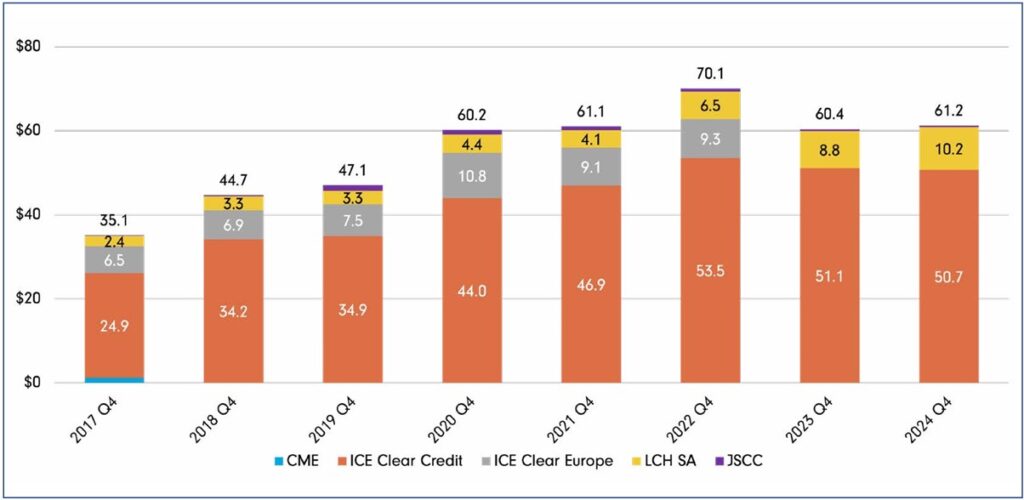
Chart 5: Required IM for cleared CDS (USD billions). Source: 2024 ISDA margin survey.
Charts 3, 4, and 5 show that IM on cleared IRD and CDS followed uncleared OTC derivatives in remaining effectively flat YoY.
Quarterly IM disclosures
Before reviewing the survey totals overall, we should look at the quarterly cleared IM data from the CCPView disclosures tab.
As a sidenote, CCPView provides a complete and browsable view of all quarters’ IOSCO CCP disclosures, including cleared IM and many more disclosure items. We cover these in our quarterly blog series – for example, What’s new in CCP Disclosures – 4Q24. In addition to cleared IRD and CDS, CCPView disclosures data cover OTC FX derivatives and all asset classes of ETD.
By comparison with charts 3, 4 and 5, CCPview shows the following on cleared IRD and CDS in chart 6.

Chart 6: Quarter-by-quarter required IM posted for cleared IRD by CCP (USD billions). Source: CCPView CCP disclosures.
The chart shows that, before settling back to less than 1 percent down YoY, IRD cleared IM by quarter varied over a range of about $36 trillion (11 percent) within 2024.
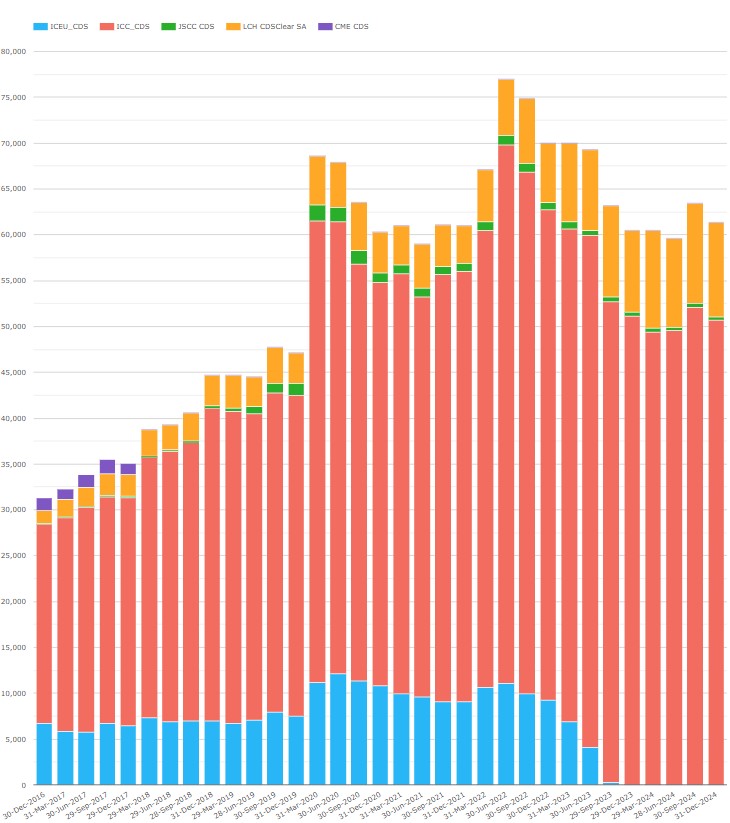
Chart 7: Required IM for cleared CDS (USD billions). Source: CCPView CCP disclosures.
Chart 7 shows that, before settling to a little more than 1 percent up YoY, CDS cleared IM by quarter varied over a range of about $3.8 trillion (4 percent) within 2024.
For FX derivatives, we look at LCH ForexClear, since the CCPView volumes tab tells us that it represents 96.7% of the cleared FX notional outstanding.
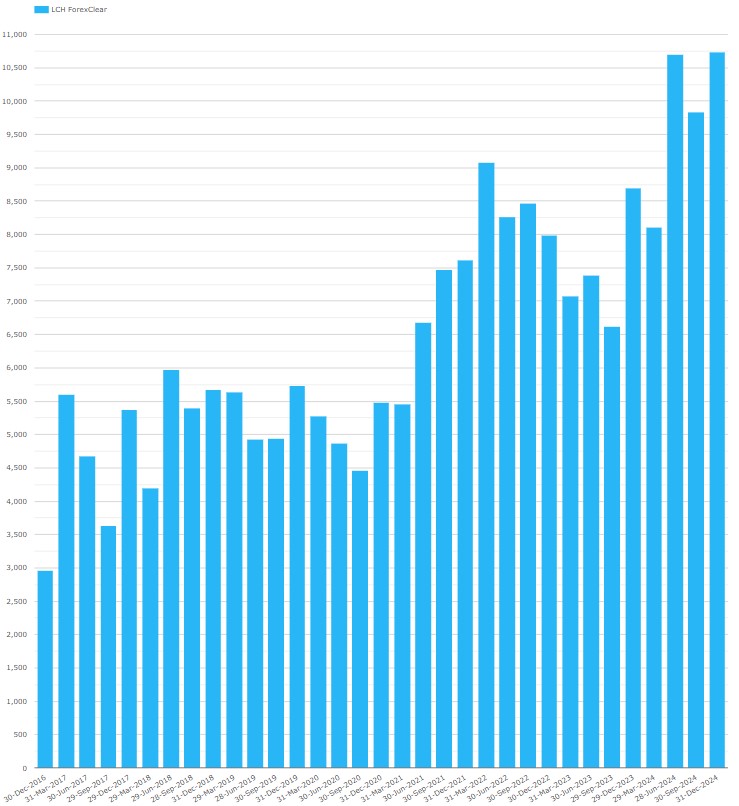
Chart 8: Required IM for cleared FX derivatives (USD billions). Source: CCPView CCP disclosures.
Chart 8 shows Q4 2024 ForexClear IM at $10.7 billion, up by $2.0 billion (24 percent) on Q4 2023.
To finish this section, we look at ETD IM.
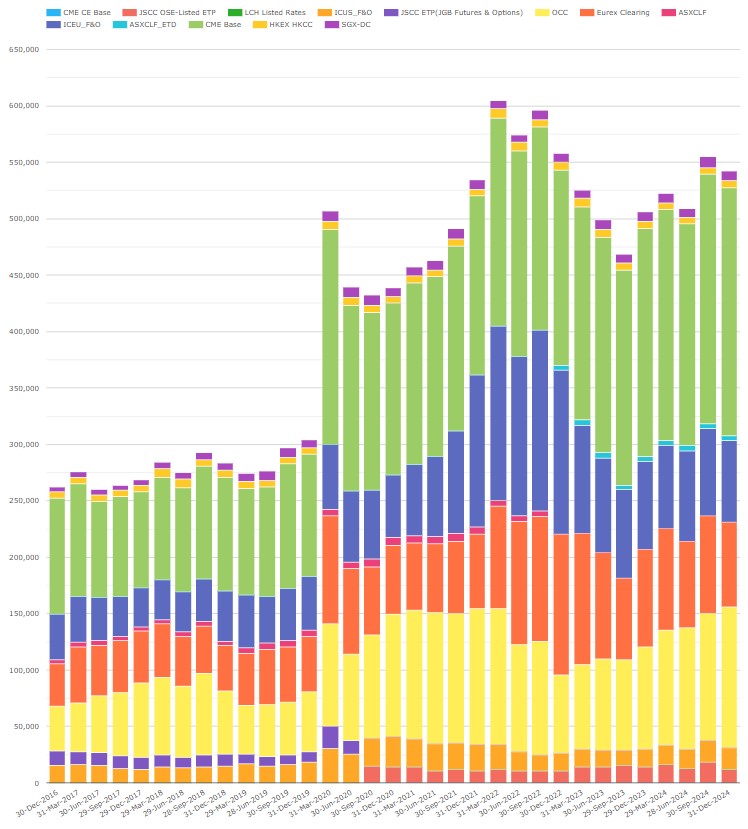
Chart 9: Required IM for cleared ETD (USD millions). Source: CCPView CCP disclosures.
Here we see Q4 2024 ETD at IM at $533.8 billion – up $27.9 billion or 5.5% from Q4 2023. Cleared ETD IM by quarter end varied over a range of $49 billion (10 percent) during 2024.
The main takeaway from the CCPView charts is that, in 2024, cleared OTC IM varied a little quarter-by-quarter even though flat YoY, while ETD IM increased modestly.
Total IM YoY
Adding cleared ETD (all asset classes), cleared OTC (IRS, CDS, and FX) and uncleared OTC (all asset classes) together, total IM was $1,375 billion at the end of 2024 – up a modest $37 billion (3 percent) from a revised $1,338 billion at the end of 2023. Cleared ETD IM alone was up $37 billion, while both cleared and uncleared OTC IM were flat YoY.
The YoY flatness in total IM means that charting the YoY shift in shares of the total IM is not illuminating, so I skipped the charts. Instead, it suffices to say: ETDs’ share of total IM rose from 37.8 percent to 39.5 percent, while cleared and uncleared OTC derivatives each lost less than 1 percent share.
The flat YoY profile of uncleared IM in 2024 came right after record growth in 2023, due partly to ISDA SIMM recalibrations (see our prior blog). Does this mean the portfolio transition into SIMM is over?
This portfolio transition increases the proportion of derivatives portfolios and portfolio risk caught by SIMM IM over time as legacy trades roll over into new trades caught by UMR. Legacy trades are UMR-exempt because their start date was before the applicable phase go-live date. This transition (assuming constant rates risk appetite from all participants) should take several years given IRD portfolios usually have an average maturity of 5-7 years and contain some trades out to 30 years or more. It is unlikely that that transition is over yet, but after 8+ years since phase-one go live it is reasonable to expect deceleration of the yearly increases.
We should look at the 2025 and 2026 editions of this blog before cancelling any trends.
Total IM over time
Instead, let us chart total IM over a longer range, starting from the end of Q1 2017 – the first time ISDA surveyed uncleared IM and plotting year-ends through the end of 2024.
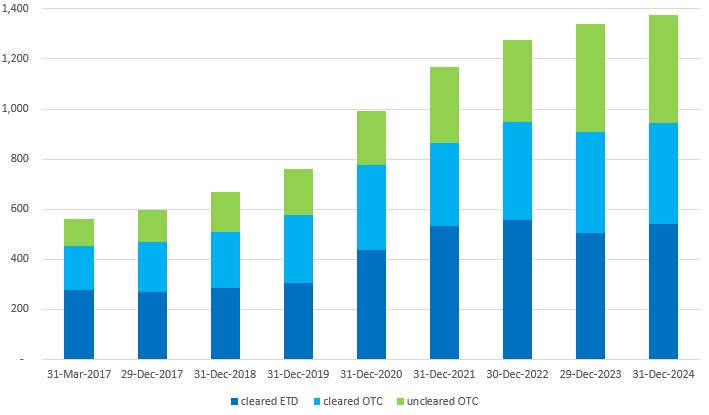
Chart 10: total derivatives IM by category ($ billions). Source: ISDA margin survey, CCPView CCP disclosures, author analysis.
Charts 10 shows that:
- Total derivatives IM grew by $206 billion in the last three years after adding $607 billion before that.
- ETD IM grew $8 billion in the last three years after adding $259 billion before that.
- Cleared OTC IM grew $71 billion in the last three years after adding $151 billion before that.
- Uncleared IM grew by $127 billion in the last three years after adding $197 billion before that. 2023 was the biggest recent annual increase (the year of ISDA SIMM recalibrations with a material effect).
So, growth is decelerating in all three categories.
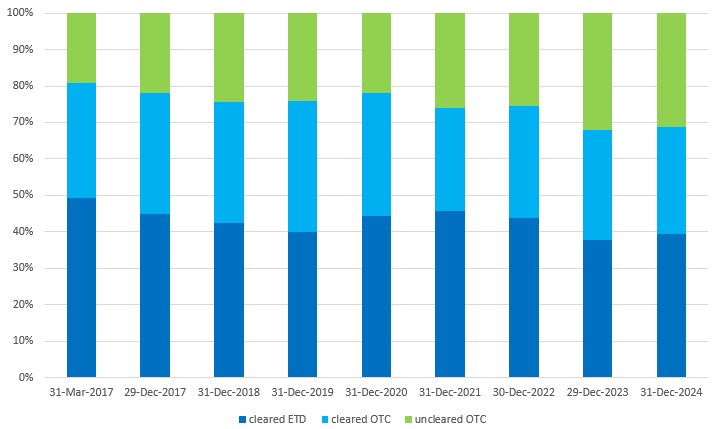
Chart 11: selected quarters total derivatives IM share by category ($ billions). Source: ISDA margin survey, CCPView CCP disclosures, author analysis.
Chart 11 shows that:
- Uncleared IM share increased from 19 percent to 31 percent of total IM. In the last three years, the biggest shift was in 2023, in which 6 percent was added to uncleared IM share.
- Cleared OTC IM share declined from 32 percent to 29 percent.
- ETD IM share declined from 49 percent to 41 percent.
The shares seem to vary less over time.
Recap
ISDA’s annual survey provides unique uncleared IM estimates and summarizes IRD and CDS CCP IM disclosures.
CCPView covers cleared IM CCP disclosures quarterly, and includes all asset classes of OTC derivatives and of ETD. It also covers a plethora of other CCP disclosed facts and figures.
Combining both datasets leads us to conclude that total derivatives IM stands at $1,375 billion at the end of 2024. Interestingly, both cleared and uncleared OTC derivatives IM were flat YoY. However, we do not infer that the SIMM portfolio transition is over.
Looking over the longer term, total IM growth is decelerating.
Contact us if you are interested in a CCPView subscription.