aka “How Volatile is Initial Margin?”
The month of November has seen a very significant market movement for most markets, and in particular for fixed income derivatives. Some of our clients this past month have seen some massive swings in margin requirements for their cleared swaps, and I was intrigued to go see if this was due to either:
- More risk being put on
- Margin requirements changing

Now, we do not have access to our client’s accounts, so we cannot determine if more risk was put on by the industry post-Trump. But the increase in margins are real (we are told), and we are able to investigate part (2) – whether Margin requirements have changed. Amir touched on it in his recent blog here – where he observed many of the US election scenarios are now in the tail of worst case losses.
So the question is – just how significantly have margins changed? And why? Or put another way – how volatile is Initial Margin?
NOT YOUR GRANDFATHERS MARGIN REQUIREMENTS
I spent my early years in the industry focused on FX. The world of physical FX margining is typically very straightforward. That is to say, your broker chooses to give you a very linear margin requirement, for example, 10x leverage. So if you have $100,000 in margin deposited, you can put on $1,000,000 in FX position. And this doesn’t change, except when the broker wakes up and says that they expect some volatility, so they change it to 5x leverage (so that your $1,000,000 FX position now requires twice the amount of margin).
Full disclosure, more sophisticated models exist particularly within prime brokerage across multiple asset classes, which tend to gravitate towards VaR, simulations, and more specifically historical simulations.
Hopefully it’s clear that the world of cleared rates swaps leverage historical simulations. What this means is that the CCP’s are estimating potential losses based on many years of historical market events. If this is not clear, there are plenty of articles on the Clarus blog to fill you in on HistSim and margin.
CHANGES IN MARGIN
To begin with, let us construct some sample portfolios. I think it best to have four portfolios, each with 2 trades, representing a combination of directional and curve positions:
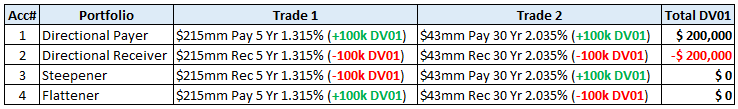
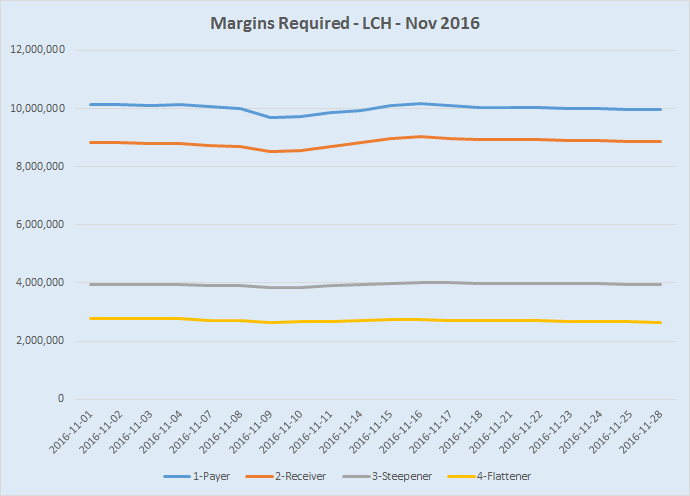
Using the CHARM API, I run these portfolios for each day over the course of November, and get the following results for CME Margins:
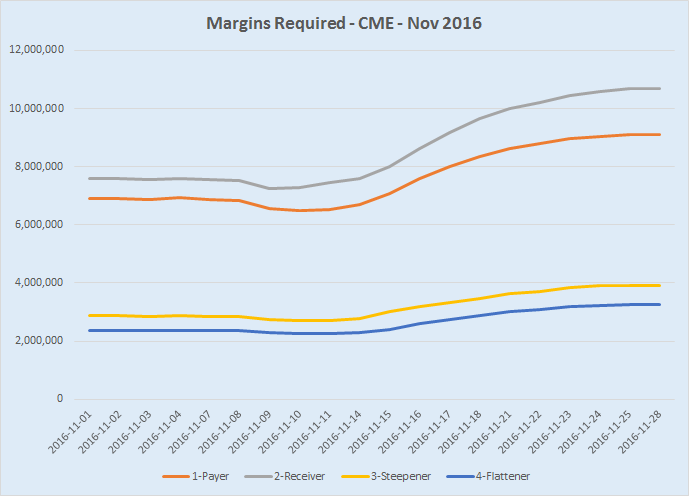
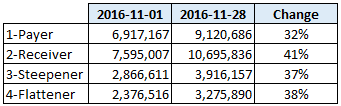
You can clearly make out the significant increases here. Looking at this in tabular format, we can explore the start and end of the month values, and their respective changes:
Intuition should explain the increase for the fixed rate receivers (account #2), as we should expect the significant rate increases during November to account for significant losses, and these are now included as tail events in our historical scenarios. Case in point, have a quick look at closing swap rates over the course of November:
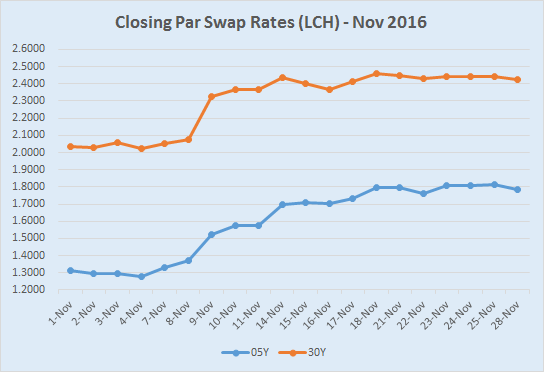
For the 30Yr swap rates, we can make out a 1-day change of 25bp on Nov-9, and multiple 5-day changes of 30bp or more. To be clear, these are absolute changes (absolute returns). So it’s no surprise to see these scenarios show up when we drill-down to explain our margin requirements. Below is a before (01-Nov) and after (28-Nov) drilldown to the tail events for our directional receiver (account #2):
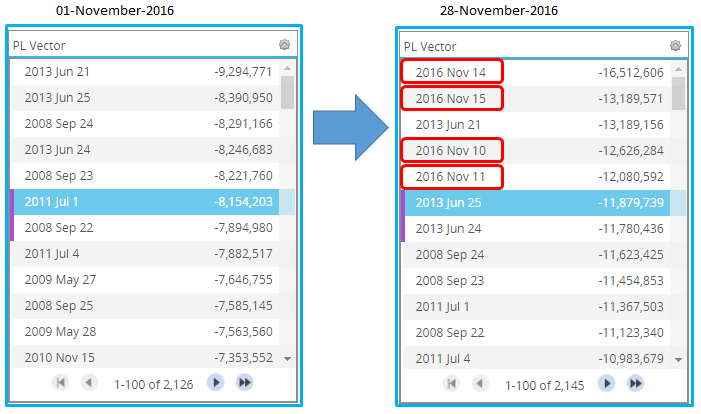
Note the 4 election scenarios now included in the results, heavily impacting our tail.
However, an astute eye will pick up that the Jun 21, 2013 scenario, which had been our worst case loss (and is now our 3rd worst case loss), has gone from a simulated $9.3mm loss to an $13.2mm loss. You might wonder how that can be.
To explain this, let’s take a simpler example where the tail events do not change. Look no further than our account #1 – the directional payer. Here is the explanation of Initial Margin on November 1st:
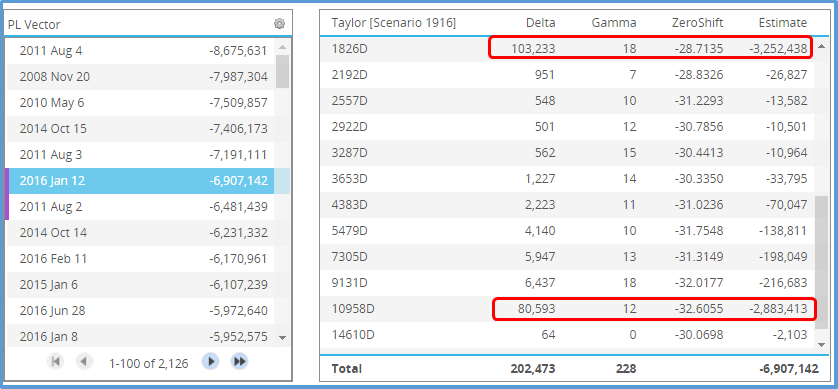
Here on November 1st, we are looking at the 6th worst case loss of $6.9mm, occuring from replaying the market shocks for the 5 days ending Jan 12, 2016. We can make out it is coming from the 5Yr and 30Yr deltas. The “ZeroShift” column shows us the 5-day returns, so -28bp and -32bp, respectively.
Now lets look at November 28th:
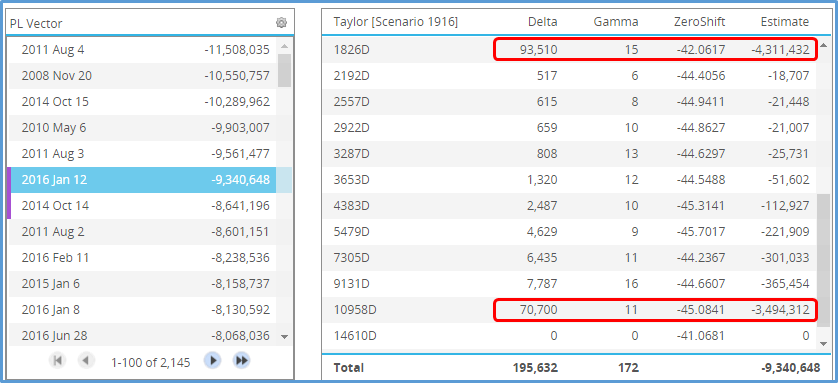
Worthy to note a few things:
- The Tail event dates are the same. The election scenarios do not impact fixed-rate payers
- Our deltas are slightly less, as the convexity of the swap has decreased our DV01 as rates increased
- The same Jan 12 scenario has significantly modified ZeroShifts. Instead of 28 and 32bp (from Nov 1), we are now using 42 and 45bp shocks. Basically increasing historical scenarios by 50%.
It is this modification of the scenarios that gives rise to the increase in margin, even on a portfolio that would profit nicely from the recent events.
Of course the raw scenarios have not changed, as we cannot change what happened on the days around Jan 12, 2016. What has happened is the absolute returns have been scaled to reflect a current perception of volatility. Much like in my FX example where your broker can decide to charge you twice as much margin based on a perception of forecasted volatility, the HVaR model can be tweaked to use scaled log returns instead of absolute returns, based upon a perception of volatility.
For further reading on this, I suggest you google “EWMA volatility scaling”. In a nutshell though, the historical absolute returns are always scaled (up or down) by a ratio of forecasted volatility to the historical realized volatilities.
So we can now make sense of the CME margin increases, as they are a combination of
- New tail events (particularly for receivers)
- Significantly scaled historical scenarios based up on a new perception of volatility
LCH
What struck me the most, however, is I also ran Initial margin on these same accounts across LCH. The results are surprisingly smooth by comparison:
To see why, lets interrogate our Receivers account. First on Nov 1st:
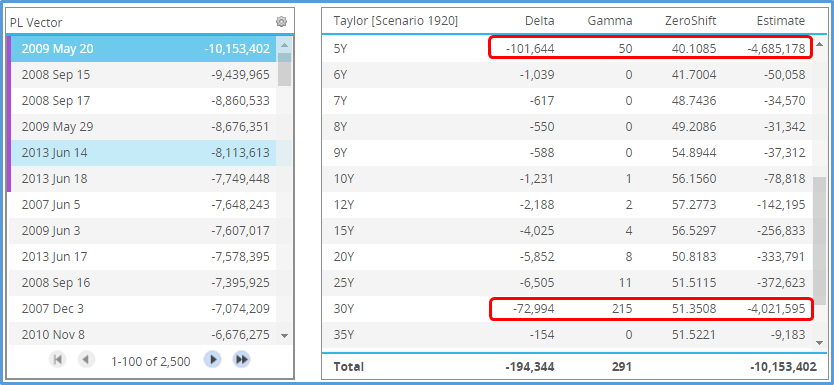
Then on Nov 28th:
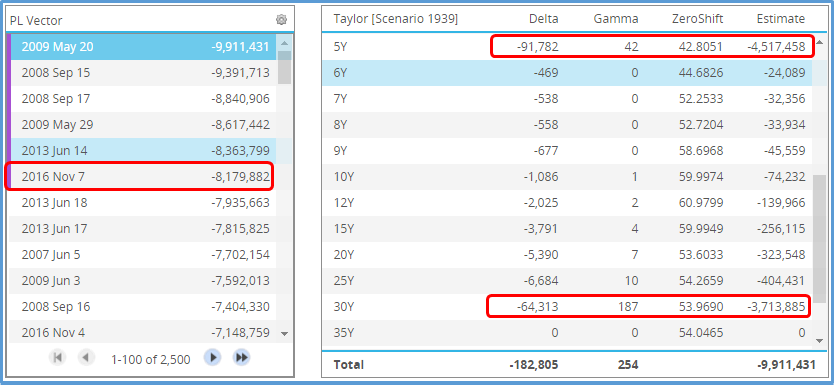
A few things to point out:
- Note the purple highlights on the scenario results. The LCH uses an Expected Shortfall measure (ES) which averages the 6 worst case losses. Whereas CME uses a VaR measure by observing the 6th and 7th worst losses. Expected Shortfall should inherently be more stable than VaR. But that doesn’t seem to explain the real reason for the margin stability we’re seeing at LCH; if we use ES on the CME scenario results, we still get a significant increase.
- By looking at the same May 20, 2009 worst-case-loss, we can identify that the LCH likewise have scaled their returns, albeit by less than CME. The LCH 5Yr scenario has gone from 40 to 42bp, and the 30Yr from 51 to 54bp.
- The November 28th margin requirement now includes one tail event from the election (the scenario commencing Nov 7)
So it would seem that we’re seeing the same symptoms at LCH, albeit not to the extent we see it at CME. And to counter both the additional tail event and the increased scaling, we have the fact that the convexity has reduced the overall DV01, thus muting the overall effects of these changes.
ABSOLUTE vs RELATIVE
So the largest contributor to margin increases at CME is the scenarios have increased in absolute terms on historical days. If you remember back to our Jan 12 2016 scenario for CME, we began the month assuming that 5-day shock was 28bp, but by the end of November, we were using 42bp shocks for the same scenario. Is this all due to scaling?
There is at least one other thing going on here. Back in 2013, Amir wrote about LCH switching their models to use absolute scenarios instead of relative scenarios. Whereas CME have stayed with relative scenarios. To understand this, assume a simple historical example where 30Yr rates go from 5.00% to 5.50%. That is a very significant 50bp increase, but in relative terms is only a 10% increase.
These relative shocks are applied to todays market data. At the start of November when 30Yr rates were 2.00%, this 10% scenario would imply a 20bp scenario applied today. However at the end of November when 30Yr rates are now closer to 2.50%, this same scenario implies a 25bp scenario. So this explains some of the increase is not due to just scaling.
Lastly, I should point out another component here that Amir wrote about back in 2014 is that CME also shift their historical market data by 4% before computing the log returns. Hence our hypothetical historical scenario is not based on 30yr rates going from 5.00% to 5.50%, but rather I believe going from 9.00% to 9.50%, which is a 5.56% increase, and not a 10% increase. This is designed to behave better in low rate environments and should temper, but not eliminate, any differences between absolute and relative returns.
DONT JUDGE
My intent today was to observe and try to describe the drivers for increases in margin over the course of the month.
Should IM respond to recent events and changes in market environments, or should it be more stable? There is not a simple answer – its worth remembering that IM is just one component of the CCP’s defenses. Case in point, while LCH’s IM might not have changed much, remember that they have tools such as more frequent intraday VM calls as an active line of defense, which should reduce the need for a more reactive margin regime.
So its inappropriate to look at IM behavior alone and conclude if one is better or worse.
SUMMARY
So margins have changed in November:
- The changes in Initial margin on sample portfolios are significant at CME, much less so at LCH
- The increases apply to both payers and receivers
- This is due to a combination of effects:
- Volatility scaling
- Additional tail events
- Relative vs Absolute returns used in scenarios
- Convexity has muted the overall risk of same-notional swaps, which seems to be enough to counterbalance these effects at LCH
- It does seem plausible, however, that a dealers LCH margins would also have risen during the month if we tweaked our test case:
- Our sample cases allowed our accounts to wind down over the month. Had we simulated 100k dv01 swaps on each day instead, we would not have the muted convexity effect. Doing this would simulate a dealer maintaining the level of risk in the account, through new activity.
- We have seen how volumes were up in November, so it seems fair to assume that dealers would have added risk over the course of a busy month
So there you have it. If you want to explore any and all of this in more detail, get your hands on CHARM.
Very helpful post Tod, but I’m not quite sure where you stand on Trump by using that image of him.