- We summarise the recent CCP12 report “Incentives for Central Clearing”.
- This report looks at the current state of play in Cleared FX, Interest Rates and Credit.
- It analyses particular niches in clearing, including Latam Rates and NDFs.
- It concludes that clearing has increased for Linear products, but Option markets remain uncleared.
- Further studies on legacy portfolios and trading activity via post-trade transparency data is vital to help understand how Option markets could develop cleared solutions that work for the market.
At the recent FIA Boca conference, the panel discussion on CCP Risk, included a reference by one of the participants to a recent report from CCP12, titled “Incentives for Central Clearing and the Evolution of OTC Derivatives”. In today’s blog I will summarise some of the interesting detail and data in this report.
CCP12 report
For those of you with an interest in the market structure of derivatives, I would highly recommend reading the full report, (available here) and for those that don’t have time to read 75 pages, this blog should hopefully suffice or at least whet the appetite for you to make time for the original.
I will cover some content from each of the main sections of the report; Market Overview, Trade Processing, Case Studies, Cost Comparisons and Conclusions.
(Note the data used in the report is either from Clarus Data Products or BIS Surveys).
1. Market Overview
Let’s start by showing Figure 1 and the text from page 9 for Central Clearing Rates of Outstanding Trades.
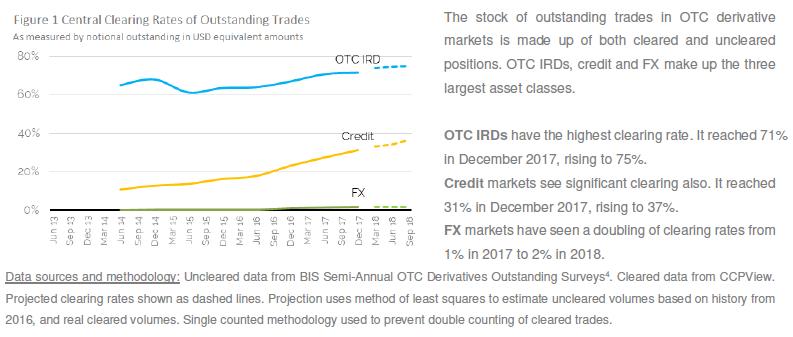
Showing cleared rates of outstanding derivatives trades have increased for:
- IRD from 65% in 2014 to 75% at end 2018
- Credit from 12% to 37%
- FX from 0% to 2%
(Note that IRD and Credit include products mandatory for clearing, unlike FX)
Next there are number of interesting charts for clearing percentages of current monthly volumes for US trade activity reported under CFTC regulations.
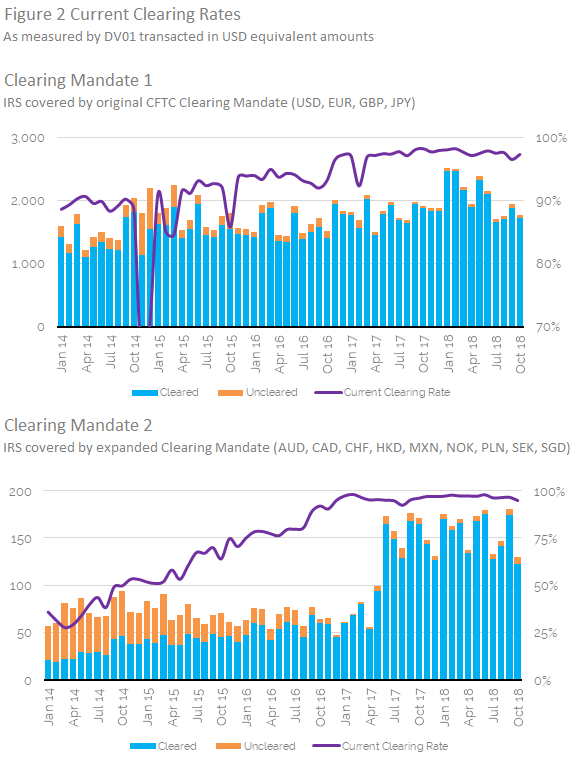
Showing the dramatic impact that extending the clearing mandate to the other currencies has made not only to cleared vs uncleared volumes but also resulted in a jump in overall volumes by 250%.
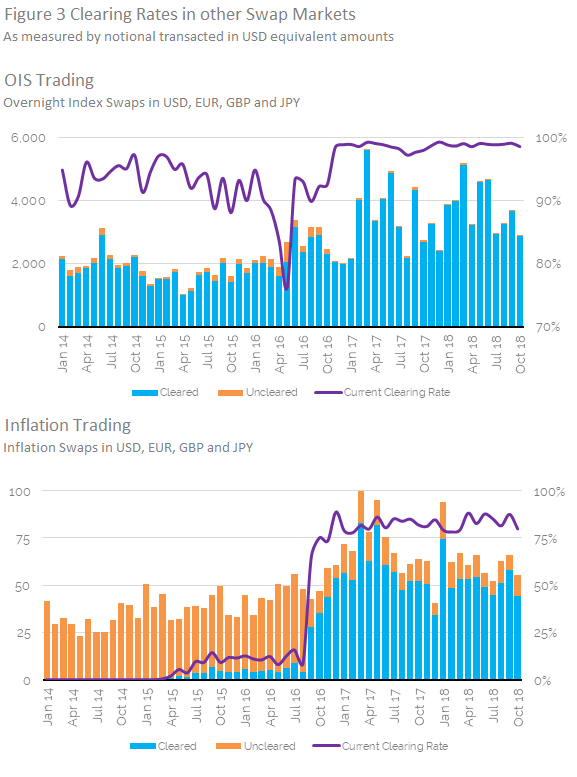
Showing that even outside mandated products, in this case OIS (>3Y) and Inflation Swaps, clearing rates are 99% and 83% respectively, with volumes higher in both. The shift to clearing for Inflation Swaps really kicked off leading up to the first Uncleared Margin Rule (UMR) implementation date in September 2016.
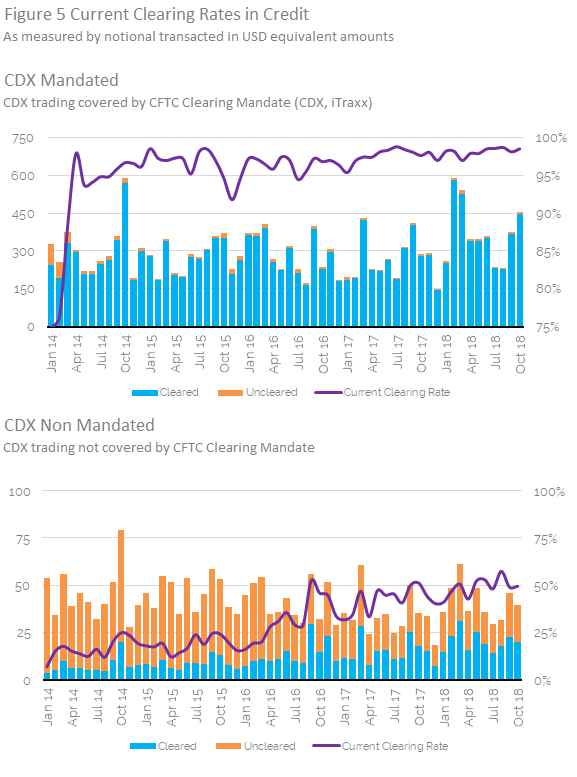
Showing that from Credit Index, either those mandated for clearing and those series not mandated, clearing rates are 97% and 50% respectively.
Lets move onto the next section, otherwise this could be a very long blog.
2. Trade Processing
This section of the report compares trade processes in Uncleared and Cleared Derivatives and in particular it focuses on some of the necessary steps to be complaint with UMR:
- Custodial arrangements
- Determination of in-scope trades
- Initial margin model implementation
- Margin reconciliation
- Liquidity and funding
And contrasts these with trade processing in clearing with regard to payment netting, variation margin, initial margin, compression, porting and defaulting management.
The gist of this section of the report is that trade processing of uncleared trades is more onerous after UMR, which further highlights the efficiency of clearing.
As it has has no charts, I will move on, but certainly worth reading in full here.
3. Case Studies
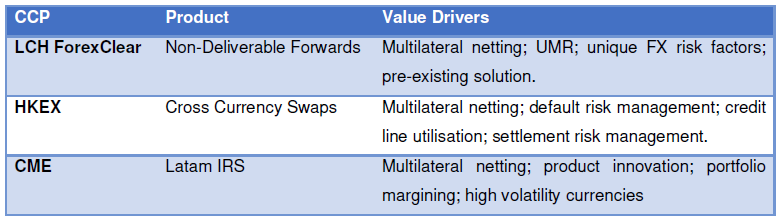
This section presents three product case studies to examine in detail which and what incentives have increased clearing rates (see value drivers in the table below).
Taking a chart from the report for each of these in turn.
NDFs at LCH ForexClear

Showing the steep growth in clearing for NDFs in BRL and KRW, where the implementation of UMR (and other efficiencies) has resulted in clearing rates in the D2D market of of 32% and 25% respectively.
Cross Currency Swaps at HKEX
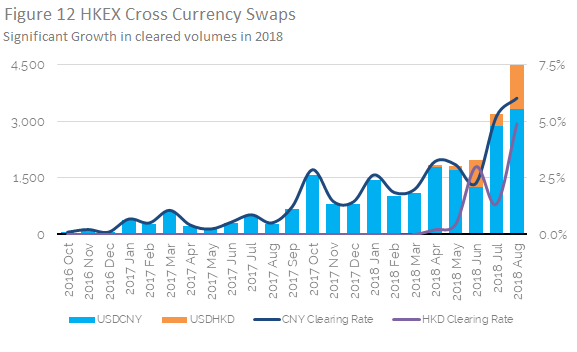
Showing monthly volumes in XCCY Swaps in USD/CNH and USD/HKD growing with a clearing rate estimated at 6% and 5% respectively.
LatAm IRS at CME
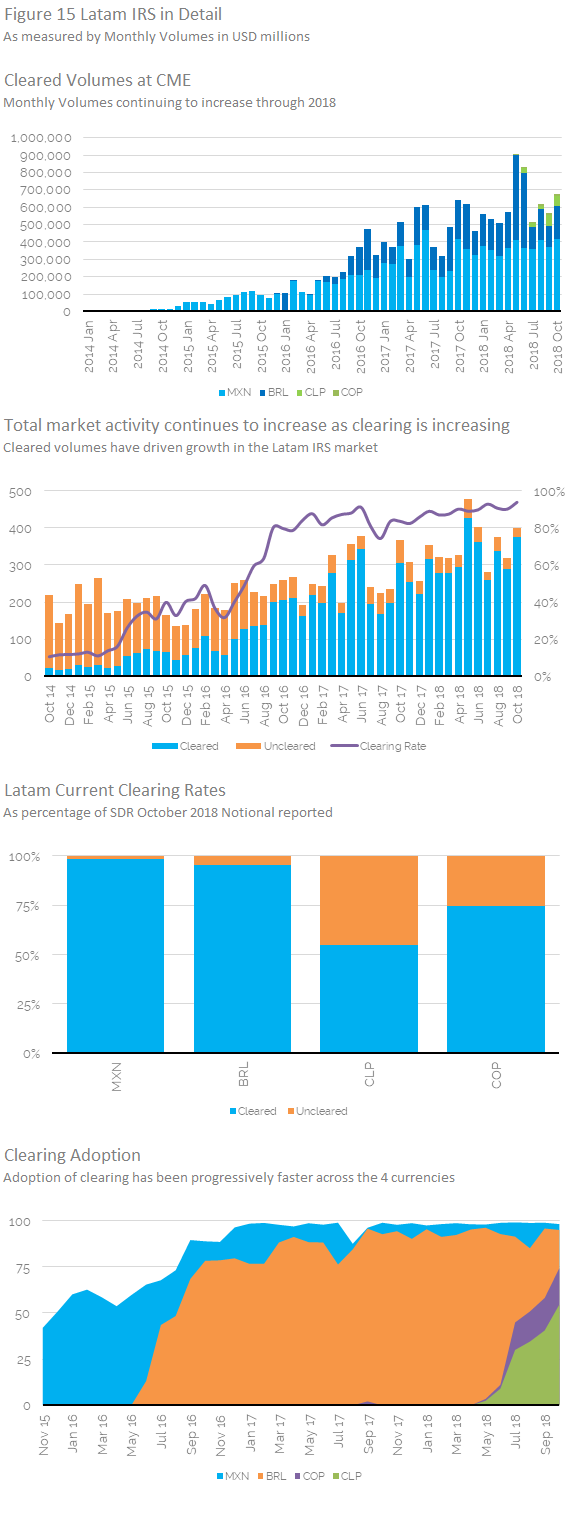
The last chart in particular shows that clearing adoption has become progressively faster, with COP and CLP very quickly approaching high clearing rates.
4. Cost Comparisons
This section of the report looks at pre-trade, trade maintenance, post-trade, capital costs, default fund contributions and compares uncleared and cleared.
For pre-trade there are sections on CSAs, UMR, Old vs New CSAs, which are well worth a read.
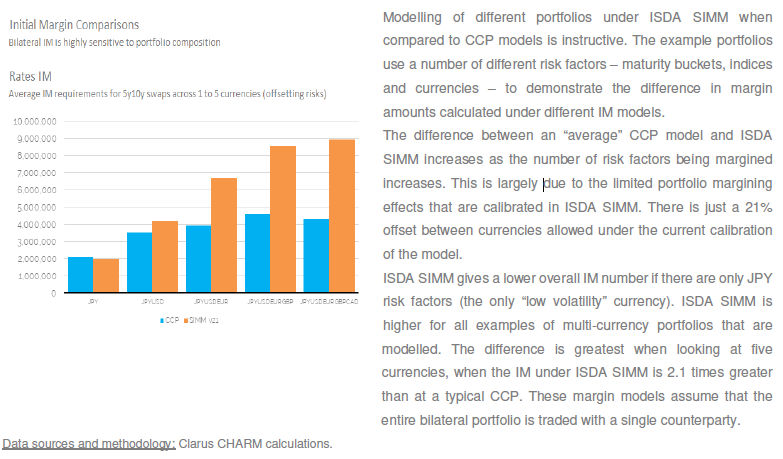
The only chart I will re-produce here is the one showing Initial Margin Comparisons between a CCP and ISDA SIMM, along with the text from page 60.
Next the final section of the report.
5. Conclusions
Definitely a must read section in the full report (see pages 69-74).
My synopsis for those of you short of time.
Clearing Rates
- Have increased with both Mandates and UMR
- IRD and CRD markets show high levels of clearing
- FX, NDFs clearing rates are 21%
- US Clearing Rates are much higher than EU, for IRD 90% vs 50%
Trade Processing
- UMR adds new costs for uncleared derivatives
- This levels the playing field between uncleared and cleared
- CCPs offer a substantially simpler and more efficient trade life-cycle
Further Studies
- Option markets, Swaptions and FX Options are large markets that show no or tiny clearing
- Given that there is good volume in cleared ETD Options, this is a topic for further study
- Legacy stock of old trades that have not been backloaded to clearing need further analysis
- Post-trade transparency in the US has contributed to many of the charts in this report
- Other jurisdictions, including Europe are still lacking in usable post-trade transparency
That’s it for today.
Did I mention you should read the full report?
You should.