In his recent blog Chris looked at Libor Fallbacks and the GBP Spread, so I thought it would be interesting to look at the spread for AUD. As we know, the first amendments to the ISDA 2006 Definitions are expected in 3rd quarter of 2019 and include fallback changes for GBP, CHF, JPY and AUD. So it is timely to look at the potential spread implications for AUD BBSW, to add to the work done on the GBP Libor.
BBSW fallbacks
Chris’ blog gives the background for the fallback methodology from the original ISDA consultation and the suggested methodology for Libor fallbacks. Like any other IBOR, BBSW will have prescribed fallbacks with two components:
- A compounded in-arrears risk free rate (AONIA) plus;
- A calibrated spread to represent the credit/liquidity spread of BBSW over AONIA. The spot spread returns to the average spread (mean or median) linearly over 1 year.
AONIA has been published for over 20 years by Reserve bank of Australia (RBA). It has changed little over that time and closely tracks the target for the cash rate.
In this article I focus on point 2 above for BBSW/AONIA and some alternatives for the spread calculation. As Chris noted, the spread calculation methodology is not settled and the alternatives can give very different outcomes.
I also look at the options for the average calculation.
BBSW/OIS and BBSW/compounded AONIA spreads
The RBA data is available for the public in section 4 of the cash rate overview. The data runs from January 2011 to the present and includes the official cash rate, AONIA, closing BBSW and closing OIS rates. Using this data, I calculated the BBSW minus OIS spread for the 3 month pillar. This is readily observed and often traded in the market.

The green line is the AONIA rate while the blue line is the BBSW – OIS spread.
The spread increased rapidly in 2012 during the EU sovereign crisis to a maximum of 63 basis points. As rates fell during 2012 and credit/liquidity concerns abated, the spread fell to 1 basis point. The spread has been rising since then to a level of 60 basis points at the end of 2018. It is also interesting to note that the spread had been rising since mid 2017 even while AONIA has been constant at 1.5%
The next chart is the actual spot spread calculation to be used for the ISDA fallbacks. This is the BBSW (set in advance) minus the compounded AONIA (set in arrears) over the same 3 month period.
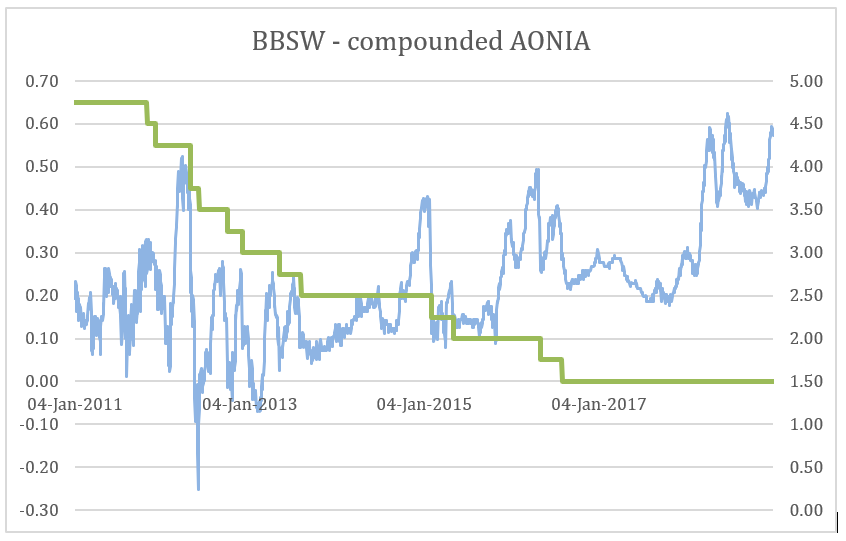
The BBSW – compounded AONIA spread is quite different to the previous chart of BBSW – OIS.
The performance during the 2012 crisis is quite different. The spread falls quickly from +50 basis point to -25 basis points and is quite volatile.
Since 2017 the two spreads have been very similar probably due to the flat cash rate and no expectation of any change which may be reflected in the OIS.
The second chart (BBSW – compounded AONIA) is the most relevant for the proposed ISDA fallbacks. This is the version favored by many respondents in the 2018 consultation.
However, this is not easily observed in the market due to the timing differences of the rate sets. We tend to focus on the results of chart 1 (BBSW – OIS) which is observable in the market but this is not the proposed calculation.
Why the spot spread difference?
The two spread calculations are quite different.
The BBSW – OIS spread is readily observed in the market because both rates are available simultaneously, i.e. at the start of the period.
But the BBSW – compounded AONIA spread is only known after the final day of the period and each leg is effectively observed at a different time: the BBSW on day 1 and the compounded AONIA on the final day.
While we usually directly observe the BBSW – OIS spread, the BBSW – compounded AONIA is the actual spot spread to be used in the ISDA fallbacks.
And, as we can see from the two charts, it can be quite different and more volatile to the readily observed spread!
The average spread
The second calculation is the average spread. While this has not been defined yet, I will now look at a few of the options including the mean and median spreads.
The next chart shows the spot spread minus the mean spread for a 1 and 3 year average.
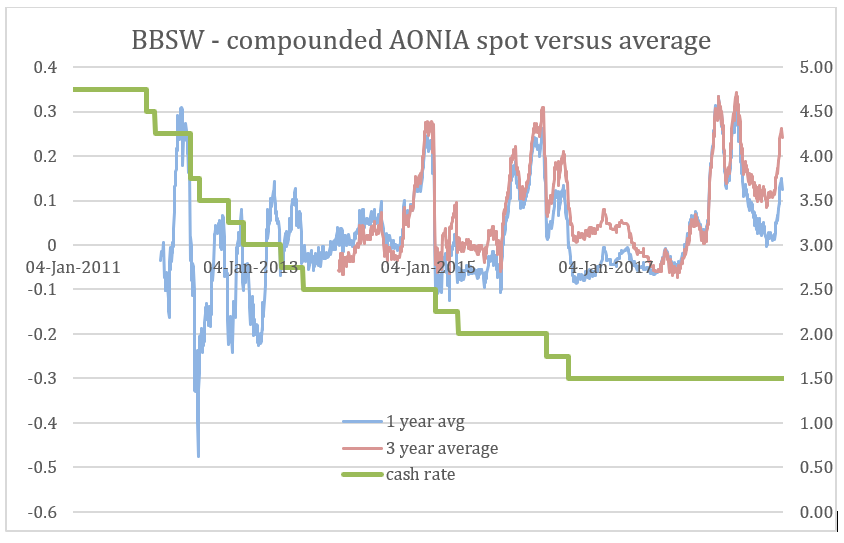
The spread on the chart shows the difference between the spot spread and the mean spread. Put another way, this is the spread that has to be closed over a 1 year period referred to in the proposed ISDA fallbacks. The 1 and 3 year spread are quite well aligned but, as expected, the 3 year version (the red line) is somewhat less volatile.
But what happens when we use the median rather than the mean spread? This is an option in the proposed ISDA fallbacks and the next chart shows the spread between the spot spread and the 1 and 3 year medians.
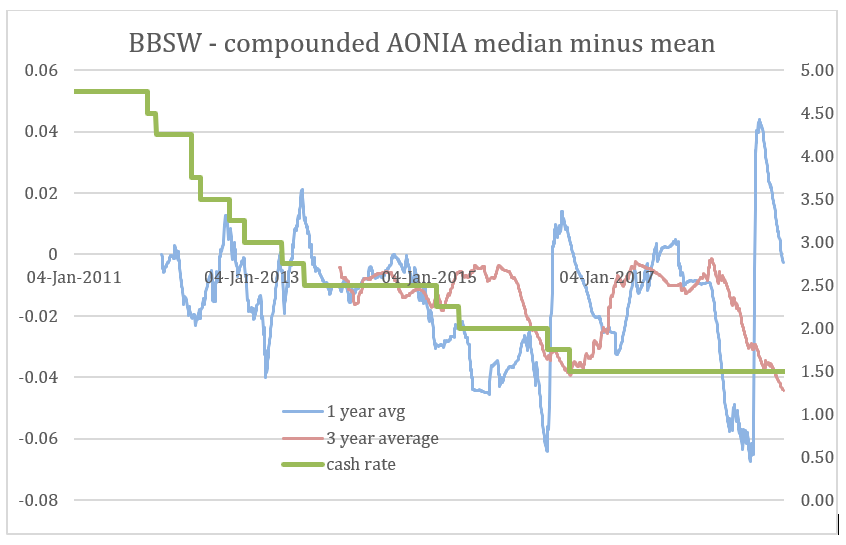
From this analysis we can see that the mean and median spread outcomes can quite different.
This is particularly notable during times of rapid spread change such as 2018 in the second chart. The median and the mean are different measures and can change at different rates.
As Chris pointed out, a trimmed mean or median may address some of these issues and could be considered.
The decision on the averaging period and the mean/median is still to be finalized before the final methodology is set.
Summary
Like the GBP example, the AUD fallback for derivatives to be introduced later in 2019 will have important implications for markets.
- The BBSW – compounded AONIA spread can move quickly in certain market conditions.
- The decision between the mean or median average as well as the averaging period will be important for AUD derivatives.
Over the next few months the decisions about mean/median and the averaging periods will have to be resolved.
And the outcomes of these decisions will need to be carefully analysed and implemented by market participants.