- ISDA SIMM v2.3 is effective December 5, 2020
- Updated with a full re-calibration and industry backtesting
- Initial Margin will change for your portfolios
- The change can be non-material or significantly higher or lower
- In this article I highlight some of the changes in risk weights
- However to quantify the actual impact of SIMM v2.3
- You need to run SIMM v2.3 on your own portfolios before the go-live
Version 2.3
ISDA has published ISDA SIMM v2.3 with a full re-calibration of risk weights, correlations and thresholds. The calibration period is a 1-year stress period (2008 Great Financial Crisis) and the 3-year recent period ending Dec 2019.
This means that Covid-19 market volatility in February/March 2020 has not been included in SIMM v2.3 but will be in SIMM v2.4, which will be effective Dec, 2021. While that is likely to have an impact in increasing margins, as SIMM is designed with low procyclicality in mind, the impact may not be too significant. A topic we will re-visit next year.
For now we note that SIMM v2.3 does not introduce any methodology changes, which is good as shows stability in the methodology, unlike SIMM v2.2 which had a small number of changes.
However the annual re-calibration always results in new inputs which change the margin.
CHARM
Clarus customers using CHARM or Microservices are able to easily run SIMM v2.3 and compare the margin with SIMM v2.2 for their actual or hypothetical portfolios; as in the example below.
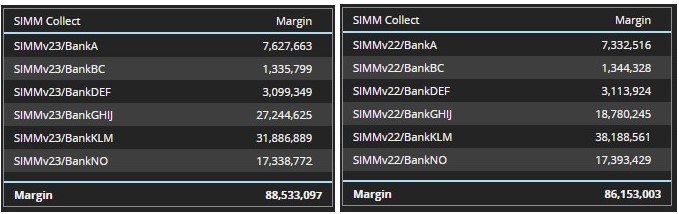
- The total gross margin increasing to $88.5million from $86.2million
- So not that significant, just a 3% increase
- However the changes at the counterparty portfolio level are more important
- And these show a wide variation
- BankGHJ increasing to $27.2m from $18.8m, a 45% increase
- (Drill-down would show the increase is from Credit risk class factors)
- BankKLM decreasing to $31.9m from $38.2m, a 17% decrease
- The remaining portfolios with much smaller changes
So not surprisingly the materiality of the change in IM depends on the risk factors in the portfolio and this change can be small, a large increase or a large decrease.
The only way to really know is to calculate SIMM v2.3 on each portfolio and compare.
Nevertheless it is possible to eyeball the new risk weights, correlations and thresholds in SIMM v2.3 and compare to SIMM v2.2 to highlight a few of the more obvious impacts on margin.
SIMM v2.3 cf v2.2
Let’s do that by risk class.
Foreign Exchange risk
- BRL is no longer a high volatility currency, meaning there are no currencies in this group
- BRL’s risk weight is down from 10.28 to 7.5, so lower margin for NDFs and FXOs in BRL/USD
Interest Rate risk
- Cross currency basis swap spread risk weight is 22 up from 20, a 10% increase
- Inflation risk weight is 50 up from 47, so higher IM for Inflation swaps.
- Vega risk weights are un-changed
- Interest rate risk weights are categorized into regular, low and high volatility currencies and within these tenor buckets. The picture here is mixed, as an example risk in the benchmark 10-year tenor is a touch higher in USD (53 to 51), a touch lower in JPY (19 to 20) and materially lower in MXN, HUF, THB (90 to 103).
- For full details please see the SIMM v2.3 and SIMM v2.2 documentation.
Equity risk
- Equity risk weights are either not changed or changed only by 1 up or down for all buckets except for 11 (Indexes, Funds, ETFs) and 12 (Volatility Indexes) which are down to 15 from 17.
- The vega risk weight for bucket 12 is up to 0.67 from 0.62.
- Correlations largely similar
Commodity risk
- Vega risk weight is up to 0.41 from 0.35, so higher margin for volatility products
- Risk weights for commodity types, the changes that stand out are North American Power (up to 57 from 42), European Natural Gas (17 from 28) and Freight (39 from 53).
Credit Qualifying risk
- Risk weights for Investment Grade sectors changes range from +11% (50 from 45) for bucket 5 (Technology, telecoms) to -11% (47 from 53) for bucket 6 (Health care, utilities, local government, government backed corporates)
- Risk weights for High Yield sectors changes range from +33% (330 from 250) for bucket 8 (Financials including government backed) to =26% (142 from 191) for bucket 9 (Basic materials, energy, industrials)
- Residual risk weight up to 333 from 250
- So we get a good idea of which sectors are more or less expensive for credit derivative positions
- Vega risk up to 0.46 from 0.39
Credit Non-Qualifying risk
- Risk weights for Investment Grade RMBS/CMBS are up to 240 from 100
- Risk weights for High Yield RMBS/CMBS are down to 1,000 from 1,600
- All other buckets also down to 1,000 from 1,600
- Significant changes in correlations
For full details please see the SIMM v2.3 and SIMM v2.2 documentation.
That’s It
SIMM v2.3 has all new risk weights and correlations.
We provide a summary of the risk weight changes.
However to get an accurate understanding of IM change.
You need to run v2.3 on your existing portfolios.
Changes can be non-material or materially up or down.
CHARM and Microservices provide an easy way to determine these.
Contact us if you are interested in doing this exercise.
Certainly worthwhile in doing with just over a month to go.