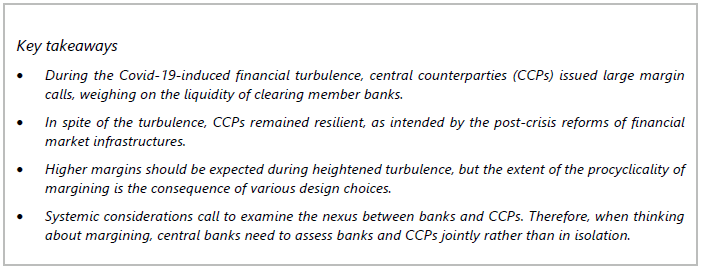
I recently read an interesting BIS Bulletin, titled “The CCP-Bank nexus in the time of Covid-19”, by Wenqian Huang and Elod Takis (available here), with the following key takeaways:
The specific part I am going to focus on today is the third bullet point, “higher margins should be expected but the extent of procyclicality or margining is the consequence of … design choices”.
But before I do that, a few highlights from the bulletin, for those you too time-pressed to read the original, though at just 6-pages, I would recommend you do read it, after finishing this blog of-course.
BIS Bulletin No 13
As always charts are great to start with and Graph 2 below is interesting to say they least.
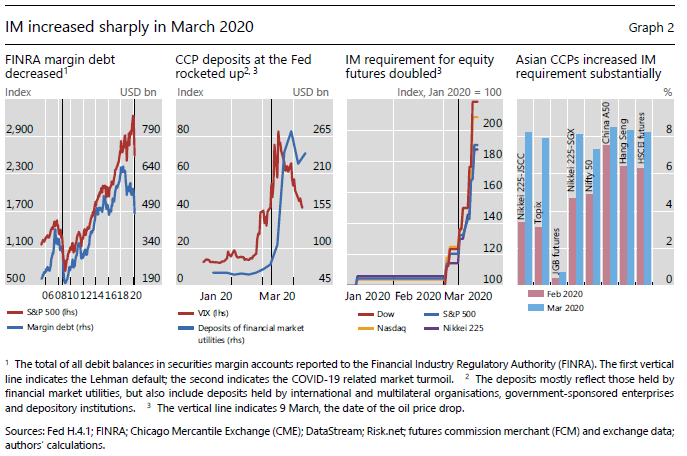
- Second panel shows that as market volatility and trading increased in March, CCP deposits at the Federal Reserve more than tripled from $70 billion to $270 billion.
- The bulletin authors state that this most likely reflects the increasing amounts of IM pledged by clearing members
- The third and fourth panel shows IM doubling for US equity futures and some Asian CCPs. Sharp increases indeed.
Next Graph 4 and pleasing to see Clarus CCPView being used and attributed.
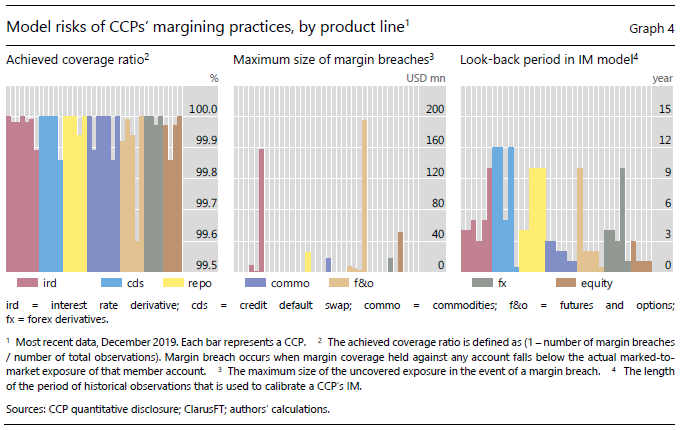
- Third panel shows the wide choice in the historical look-back period for the IM model, from less than 1-year to 12 years!
Models using short look-back periods are more likely to be procyclical, so greatly increase initial margin in a market crisis, while those with long look-back periods will include historic market moves from past crisis and consequently be less procyclical.
Let’s now look into the details of this with a real-word example.
VAR with 1-year lookback
Value-at-risk using historical simulation is one of the standard methods for initial margin calculation as well as market risk capital in Basel II.
Using Clarus Microservices, I can easily create and run the following python script:
import clarus
r = clarus.risk.var(portfolios='usd100k 30y pay',shiftSet='Clarus.1Y.1D.USD',valueDate='2020-01-31')
print (r)
- Create a portfolio with a single USD 30Y Swap in 100k dvo1 (@41m notional) at the par market rate on 31-Jan-20
- Run VaR on this portfolio, as of 31-Jan-20, using a historical shift set with a 1Y lookback period and 1D returns (MPOR)
- (Confidence level defaults to 99% and measure to VaR not ES)
So using that as a start point, we can easily write code to run VaR on each prior month end, both before and after Covid-19 turmoil.
Let’s do that to get the table below.
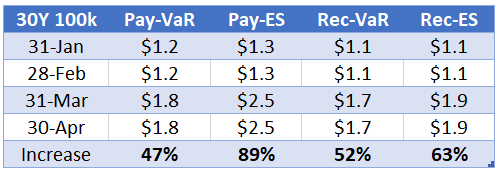
- On 31-Jan a pay fixed 30Y usd swap of 100k dv01, had a VaR of $1.2 million at 99% confidence level
- Meaning that in 1 out of a 100 days, we could expect to lose at least $1.2 million on this trade, given our historical lookback period of 1Y, implying a move of 12 bps in 30Y
- On 31-Mar this increased by 50% to $1.8m, as the new market data from 31-Mar-20 and prior determined our rolling 1Y lookback period
- If instead of Var, we use Expected Shortfall, a better measure of tail losses, the comparable increase is from $1.3m to $2.5m or 90%.
- And larger for pay fixed versus rec fixed swaps, as the March period introduced larger falls in 30Y rates than rises.
So we can see how a short lookback period of 1Y, can lead to sharp increases in IM of 50% to 100%.
VAR with 2-year lookback
Now let’s run the same example again with a 2-year lookback period and this time use a 5-day margin period of risk, common in Swaps, while Futures use a 1-day MPOR. Also a higher confidence level of 99.7% or three standard deviations.
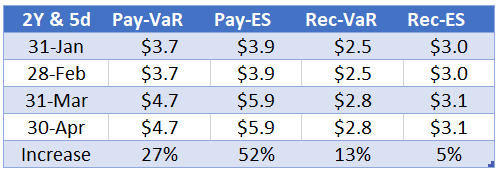
- The increases from 31-Jan to 30-Apr are now lower
- For our pay fixed trade, using VaR an increase of 27% from $3.7m to $4.7m, while for ES an increase of 52% from $3.9m to $5.9m
- So the same risk position of pay fixed 30Y 100k dv01 would have required an increase of $1m or $2m in IM depending on if VaR or ES was the metric
- Recieve fixed positions have lower IM at the start and have lower increases of 13% and 5%, suggesting that the magnitude and/or the number of increases in 30Y swap rates (which cause rec fixed to lose money) are less than those of decreases in 30Y Swap rates (which cause pay fixed to lose money), not surprising when we look at the low level of usd rates today.
Next lets turn to an actual CCP margin model for swaps.
LCH SwapClear
LCH SwapClear uses a 10-year lookback as well as a stress period and Expected Shortfall with a 99.7 confidence level, so we would expect the IM to be less pro-cyclical.
Let’s run our same trade and dates with this model.
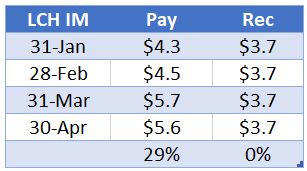
- 31-Jan the pay fixed trade required $4.3m of IM, which increased by $1.4m to $5.7m on 31-March
- While for a receive fixed trade the IM requirement stayed flat at $3.7m
- (these are house IM, client IM would be @ 18% higher).
So definitely a less pro-cyclical model, as we expected given the design.
ISDA SIMM
Uncleared OTC derivatives are margined using ISDA SIMM, which is re-calibrated once a year with a 3-year lookback period and a 1-year stress period. As it is not re-calibrated daily, unlike the Var models above, we would expect it to be even less pro-cyclical.
And indeed it is, our trade, both pay or receive, would require a SIMM IM of $6.1m, which would not have changed over the period.
An even less pro-cyclical model, by design.
Final Thoughts
It is appropriate for initial margin to increase with market volatility.
However the amount of increase is a design choice.
Too large and sudden an increase introduces stress, which may result in firms being forced to sell assets to meet margin calls, when they have already had to cover VM calls, definitely a bad time for IM to double!
Market risk turns into liquidity risk, feeding back into market prices, no-one wants that.
Margin models in Futures tend to use shorter lookback periods and are consequently more procyclical than Swaps models.
While most Futures use the SPAN model, it would be over simplistic to say that is the reason for shorter lookback periods and procyclicality, as SPAN can be calibrated for longer periods and most CCPs use SPAN in conjunction with VaR, backtesting and minimum margin rates.
However, it is generally accepted that SPAN margining needs to change.
Longer lookback periods, stress periods and the resulting higher margin in tranquil times, are the way to go.
So it is good to see that the CME SPAN 2 methodology, has a well designed framework for stressed periods.
As well as liquidity and concentration risk. (Topics for another day).
Thanks for reading to the end.
Now don’t forget to read the BIS Bulletin here.