Continuing with our monthly review series, let’s take a look at Interest Rate Swap volumes in July 2016.
First the highlights:
- On SEF USD IRS in July 2016 volume was 20% lower than June (YTD high)
- USD OIS Volumes were also down from May and June
- USD Swap Curve was up 10 to 15 bps below 4 years
- EUR & GBP volumes were also lower, but JPY were up
- For the first time we saw large On SEF Compression in JPY IRS
- GBP SONIA had another big month with similar volumes to June
- SEF Market Share shows Bloomberg regaining the lead held by Tradeweb for 2 months
- Mostly driven by lower On SEF Compression activity
- TrueEx and Tradeweb both had significant JPY IRS activity
- CME–LCH Switch volumes at $56b are up from prior months
- Dealerweb in particular with its biggest month in CME-LCH Switches
- Global Cleared Volumes were down from June highs, to the levels of April and May
- In Asia, volumes were lower across all CCPs
- In LatAm, CME showing very strong growth in MXN IRS, up from $170b to $490b
Onto the charts, data and details.
USD IRS ON/OFF SEF
Using SDRView the gross-notional volume of On and Off SEF USD IRS Fixed vs Float price forming trades (Outrights, SpreadOvers, Curve/Flys).

Showing:
- July 2016 On SEF gross notional is > $1,019 billion
- (recall capped trade rules mean this is understated as the full size of block trades is not disclosed)
- 23% lower than June 2016 and 16% lower than July 2015
- July 2016 Off SEF gross notional is > $656 billion
- 16% lower than June 2016 and similar to July 2015
- So volumes are back down from June highs to April and May levels
- And On SEF vs Off SEF is 61% to 39%, close to the YTD average
And splitting by package type and showing On SEF DV01 (adjusted for curves and flys).
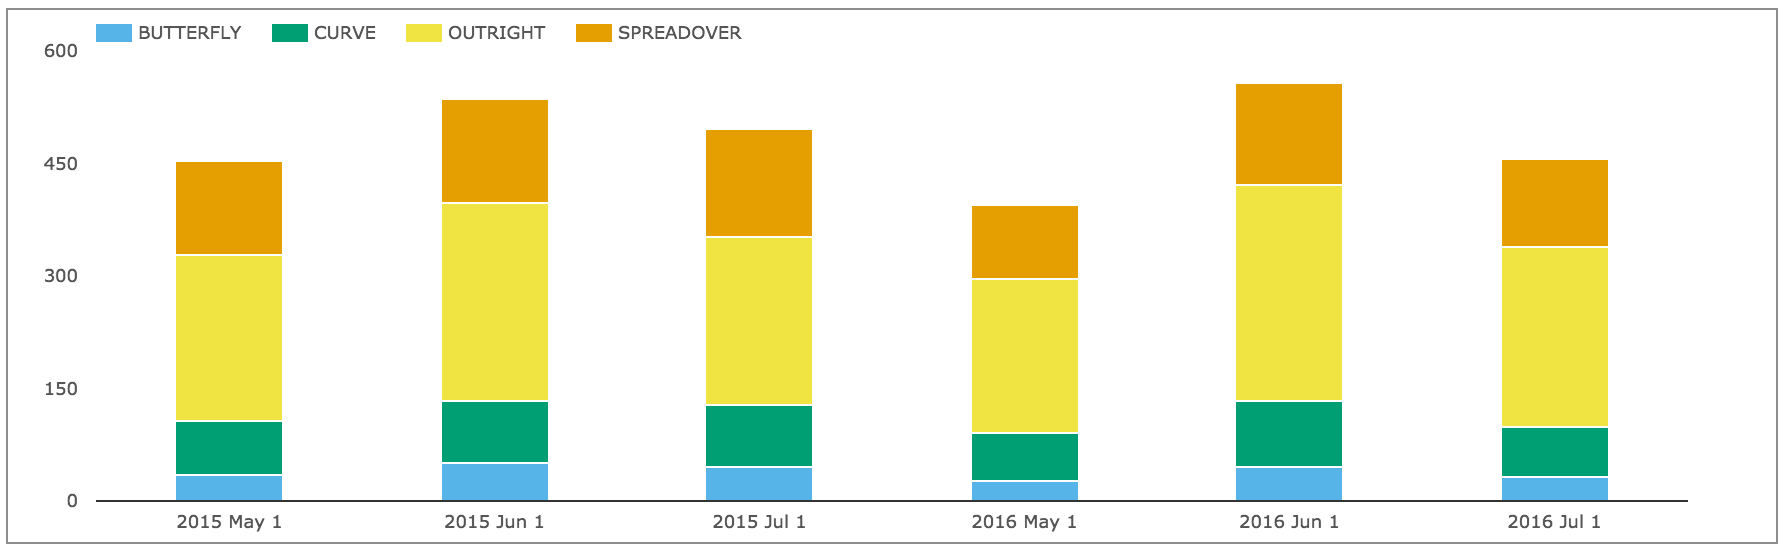
Showing:
- In DV01 terms July 2016 was 18% lower than June 2016
- Overall >$460 million of DV01 was traded in the month
- (recall capped trade rules mean this is understated)
- Compared to July 2015, DV01 is 8% lower
And gross notional of On SEF non-price forming trades; Compression and Rolls.
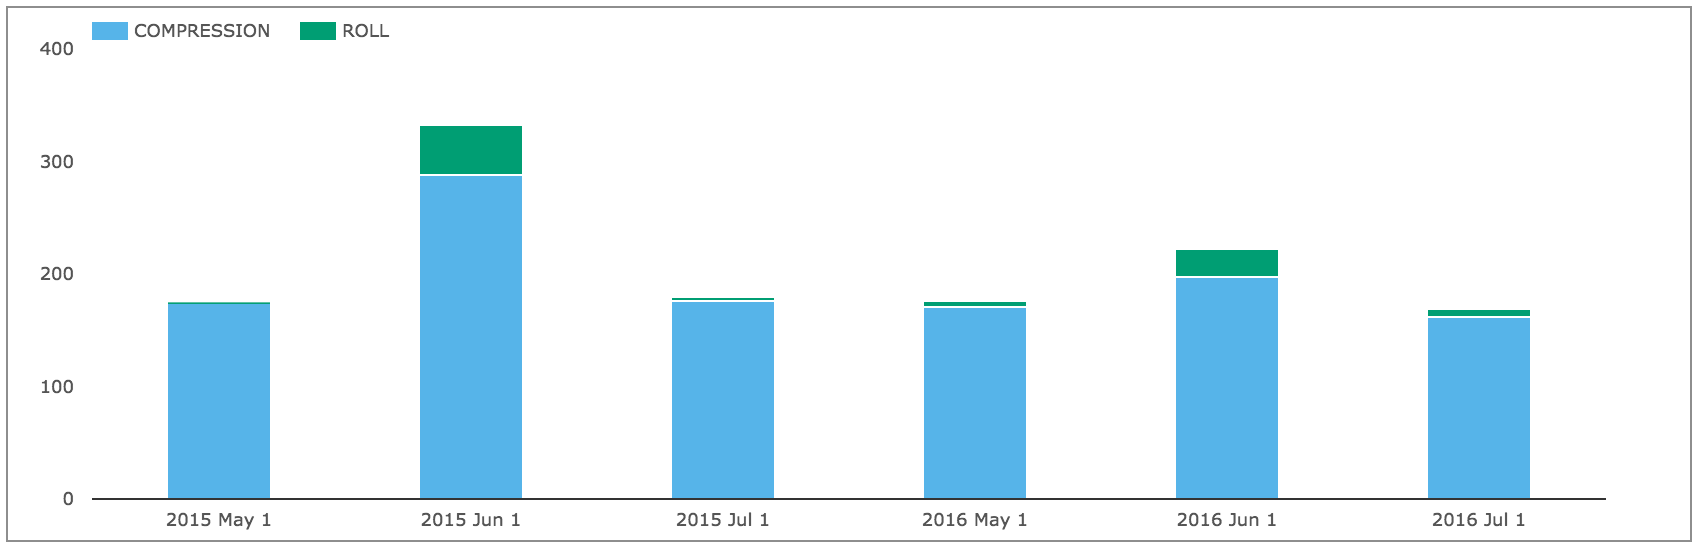
Showing:
- Compression in July 2016 was >$160 billion
- Compared to >$200b in June and >$170b in May
- And down 5% from July 2015
USD OIS Swaps
Lets check and see how volumes in USD OIS Swaps have performed.
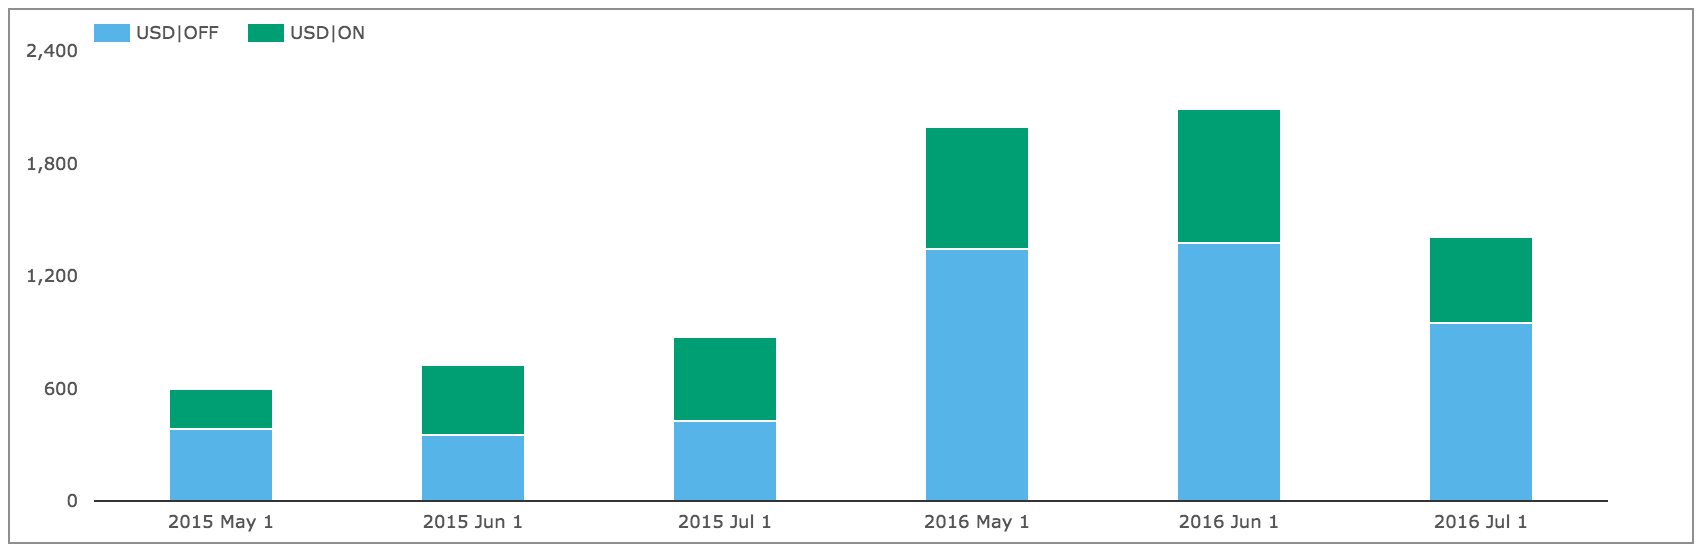
Showing:
- Volumes are down from May and June, but well above earlier months
- July 2016 Off SEF gross notional is > $950 billion
- July 2016 On SEF gross notional is > $ 457 billion
- (recall capped trade rules mean this is understated as the full size of block trades is not disclosed)
- The combined total at > $1.4 trillion is very similar to the > $1.67 trillion of USD IRS
- Granted OIS Swaps are shorter maturity, so far lower in DV01 terms than IRS
USD IRS Prices
Lets now take a look at what happened to USD Swap rates in the month.
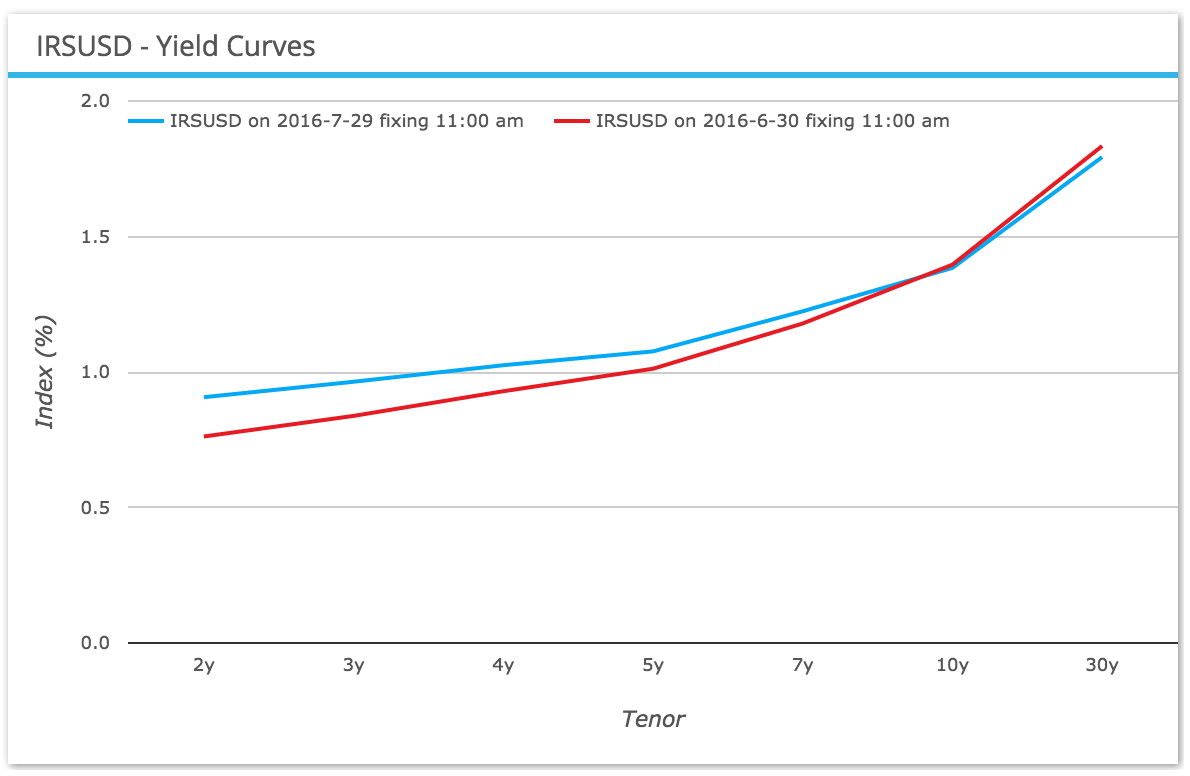
Showing:
- Red line as the Swap Curve on 30 June, Blue line as 29 July
- Rates up 10 to 15 bps below 4 years
- Rates down 1 bp at 10Y and 4 bps at 30Y
- A quiet month overall
EUR, GBP, JPY Swaps
Next On SEF volumes of IRS in the other three major currencies.
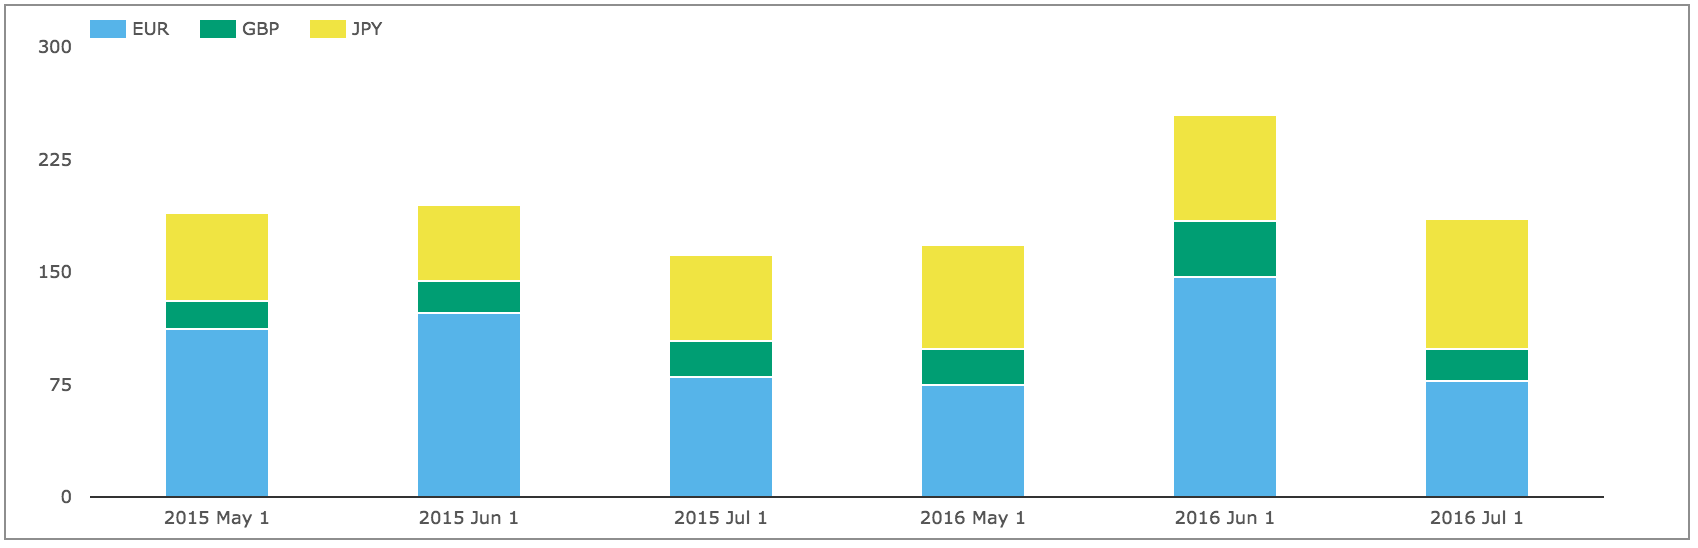
Showing:
- Volumes down from June and similar to May
- With EUR and GBP both lower but JPY higher
- Volumes 15% higher compared to July 2015
The overall gross notional in these currencies of >$184 billion is 18% of the USD volume , similar to the YTD monthly average.
And then SEF Compression activity.

Showing that while overall SEF compression volumes are down, for the first time there is significant JPY activity > $14 billion (more on this later).
EONIA and SONIA
Again similar to USD, lets check how volumes in EONIA & SONIA have performed.
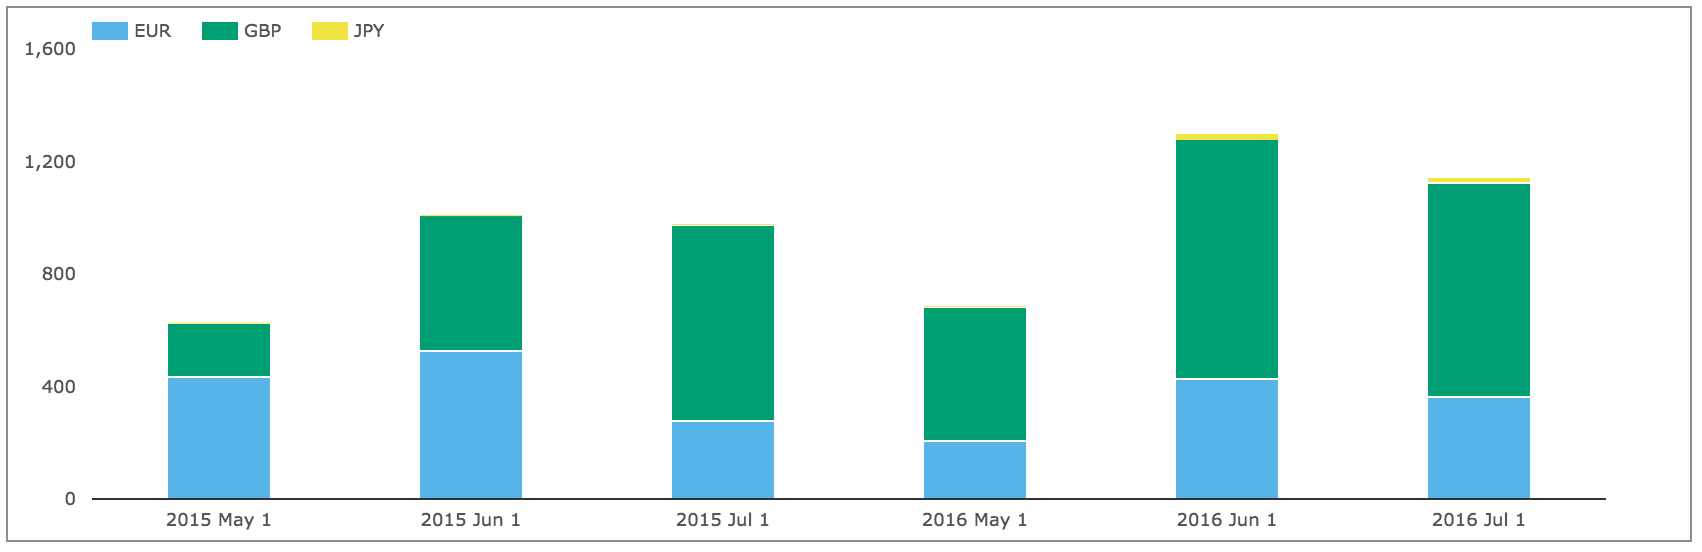
Showing that while overall volume is down from June, it remains much higher than May.
GBP SONIA in particular is high again at $760b in July compared to $850b in June and $480b in May.
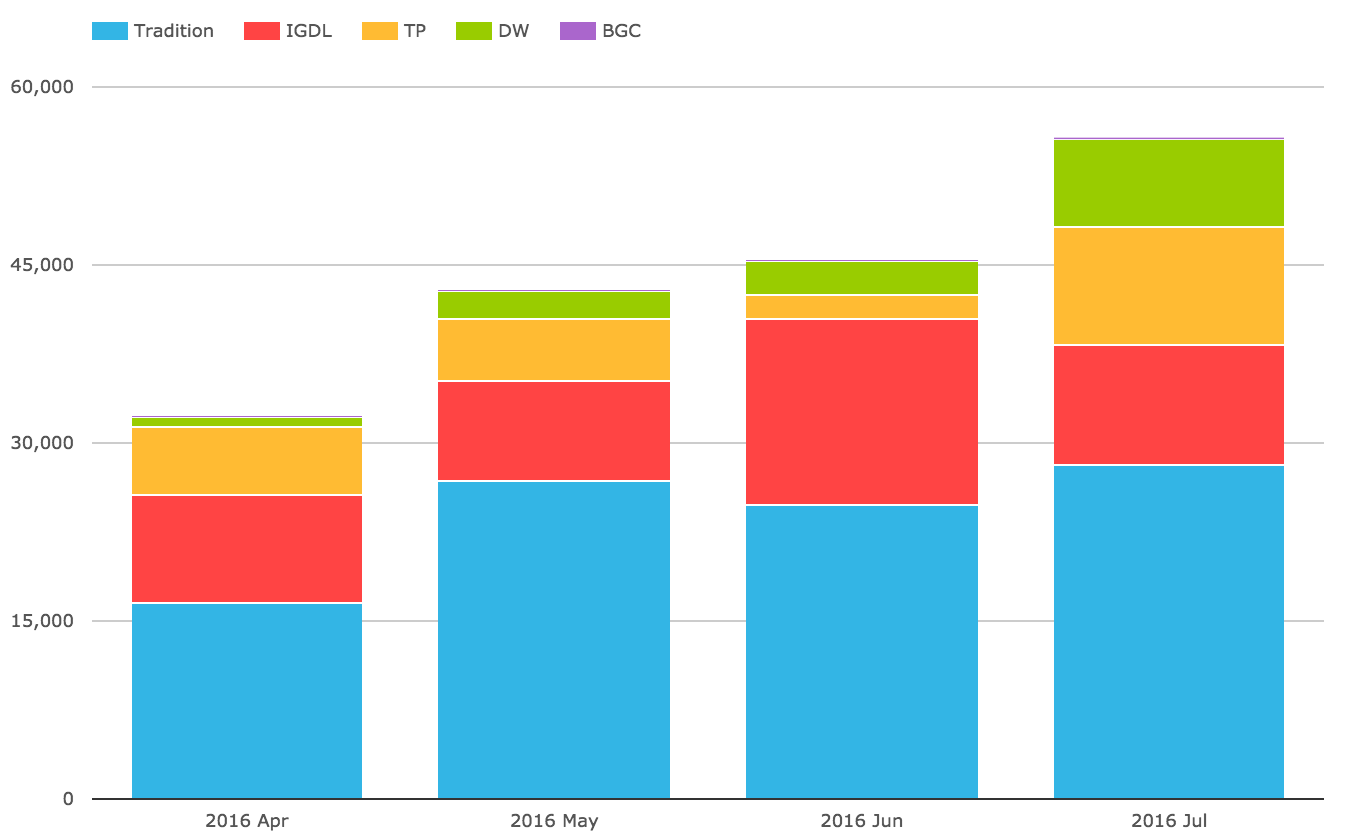
SEF Market Share
Lets now turn to SEFView and SEF Market Share in IRS including Vanilla, Basis and OIS Swaps.
DV01 (in USD millions) by month for USD, EUR, GBP and by each SEF, including SEF Compression trades and use a chart to compare the relative share in July 2016 with the prior three months.
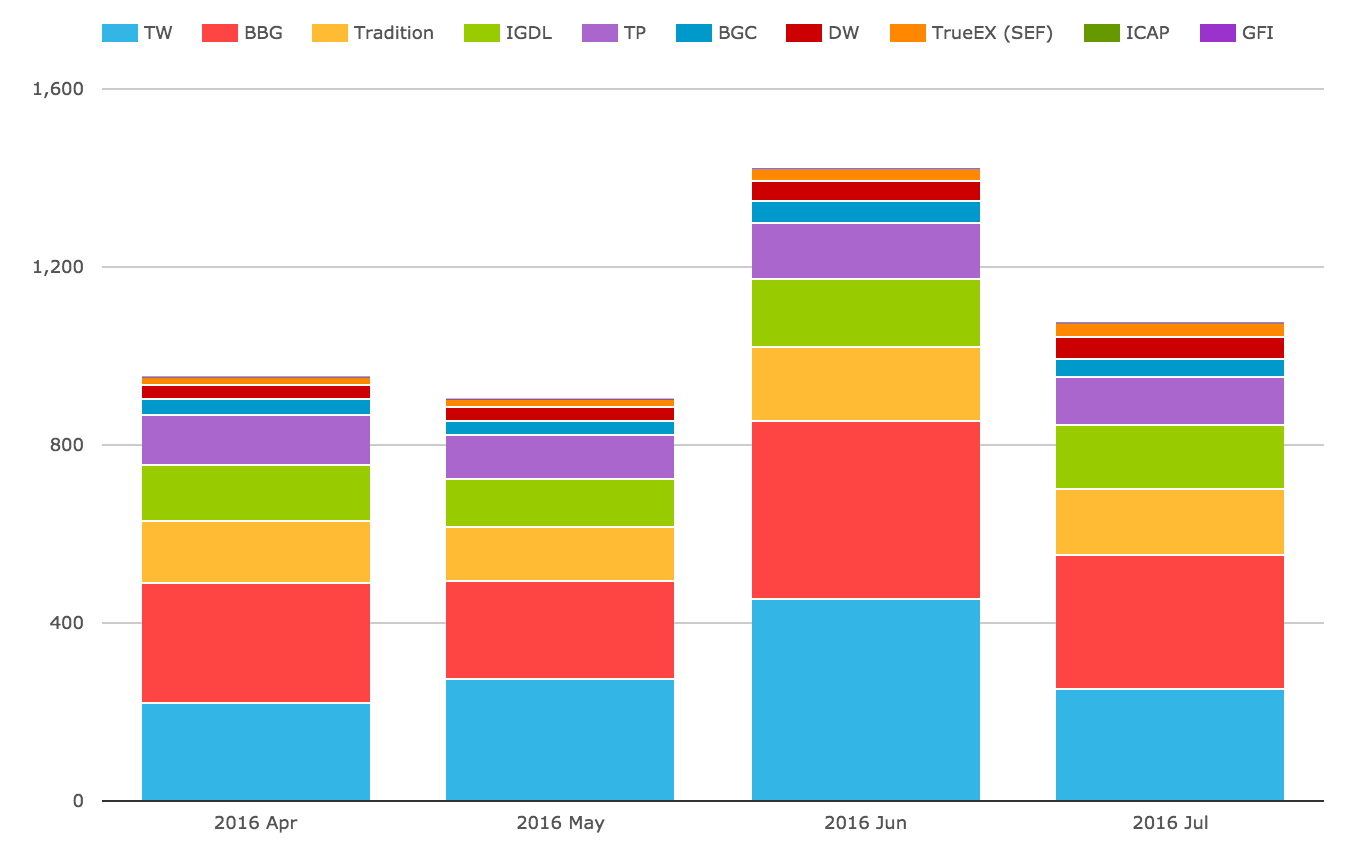
Showing that:
- July volume at $1.1b of DV01 is lower than the $1.4b in June, but well above April and May
- Bloomberg is back on top for the first time since April
- Tradeweb back to second, after 2 months on top (likely due to lower SEF Compression)
- Tradition 11.5%, ICAP 11%, Tullet 9% are each similar to prior months
- BGC 4%, Dealerweb 4%, TrueEx 3% are also as in prior months
In gross notional terms $1.4 trillion of USD IRS traded On SEF in June.
From SDRView data above, we know that $1 trillion of capped gross notional was reported, making the understatement $400 billion, a lot less than the $700 billion understatement in June; meaning that there were less trades above block or cap size in the month.
Lets now take a look at JPY IRS volumes.
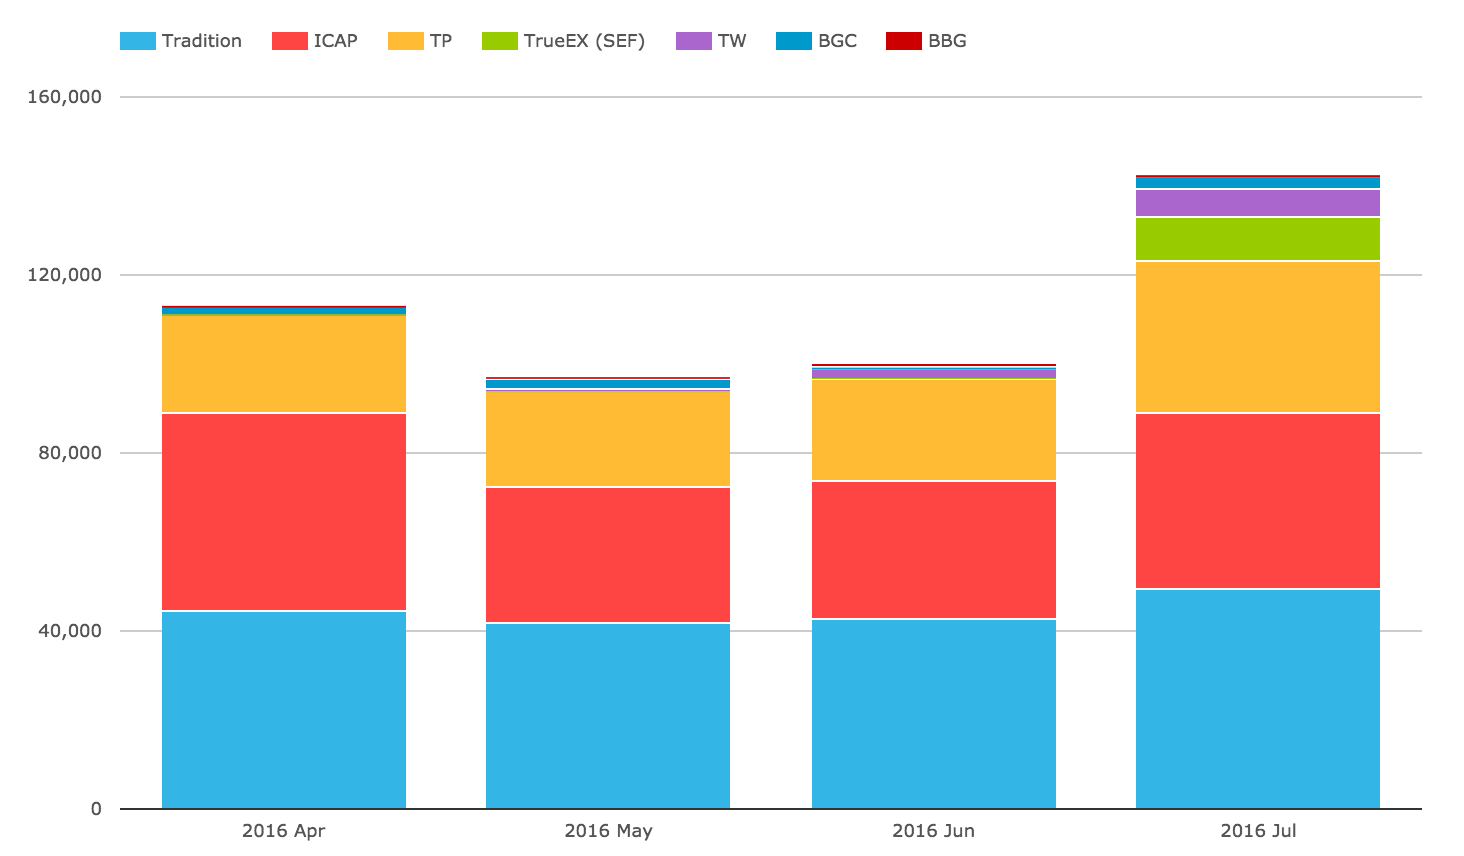
Showing:
- Strong growth in July with with $140 billion compared to $100b in June
- TrueEx volume of $10 billion and Tradeweb of $6 billion stand-out in July
- Persumably both the result of significant SEF Compression activity in JPY IRS
- Otherwise Tradition, ICAP and Tullets dominate as in prior months
CCP Basis Spreads and Volumes
In SEFView we can isolate CME Cleared Swap volume at the major D2D SEFs (on the assumption that this is all CME-LCH Switch trade activity). Lets look at this for the past 4 months.
Showing:
- Overall volume in July was $56 billion gross notional
- Up from the $45b in June
- Tradition has the largest share in the month with 50%
- Dealerweb makes a strong showing with $7.5b
- ICAP and Tullet both with $10b each
CME-LCH Basis Spreads remained at similar levels with 10Y at 2.3 bps and 30Y at 3.25 bps, which seems to be where the market has settled for a few months now on the fair value of the USD IRS CME-LCH Basis.
Global Cleared Volumes
Now onto CCPView to look at Global Cleared Swap Volumes for EUR, GBP, JPY & USD Swaps.
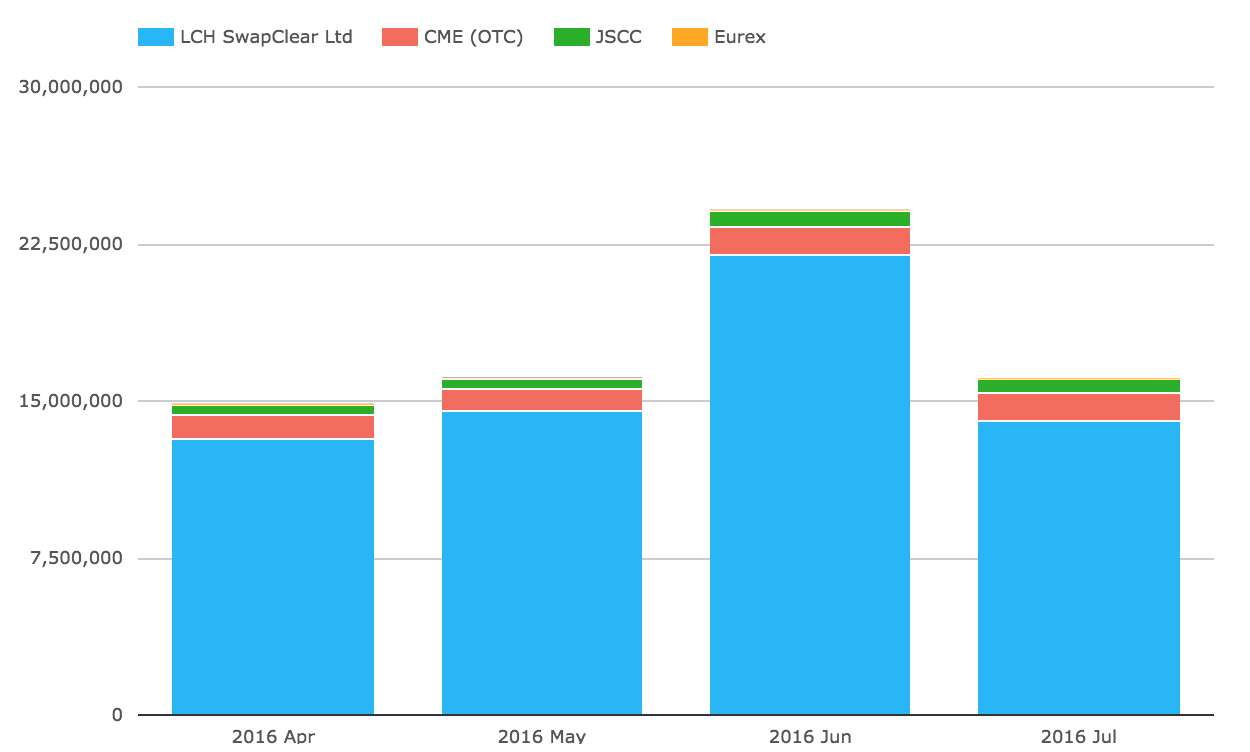
Showing:
- Overall Global Cleared Volumes back down from June highs to the April and May level
- (Just as we have seen in US SDR and US SEF data)
- LCH SwapClear volume at $14 trillion, down from June, but similar to May
- CME at $1.3 trillion, similar to June
- JSCC at $722 billion, also similar to June
- Eurex with $25 billion is down from its June $50 billion
Asia and LatAm
Before we end lets look at some charts for Asian and LatAm currencies.
First the volume of AUD, HKD, SGD Swaps (including Vanilla, OIS, Basis, Zero Coupon).
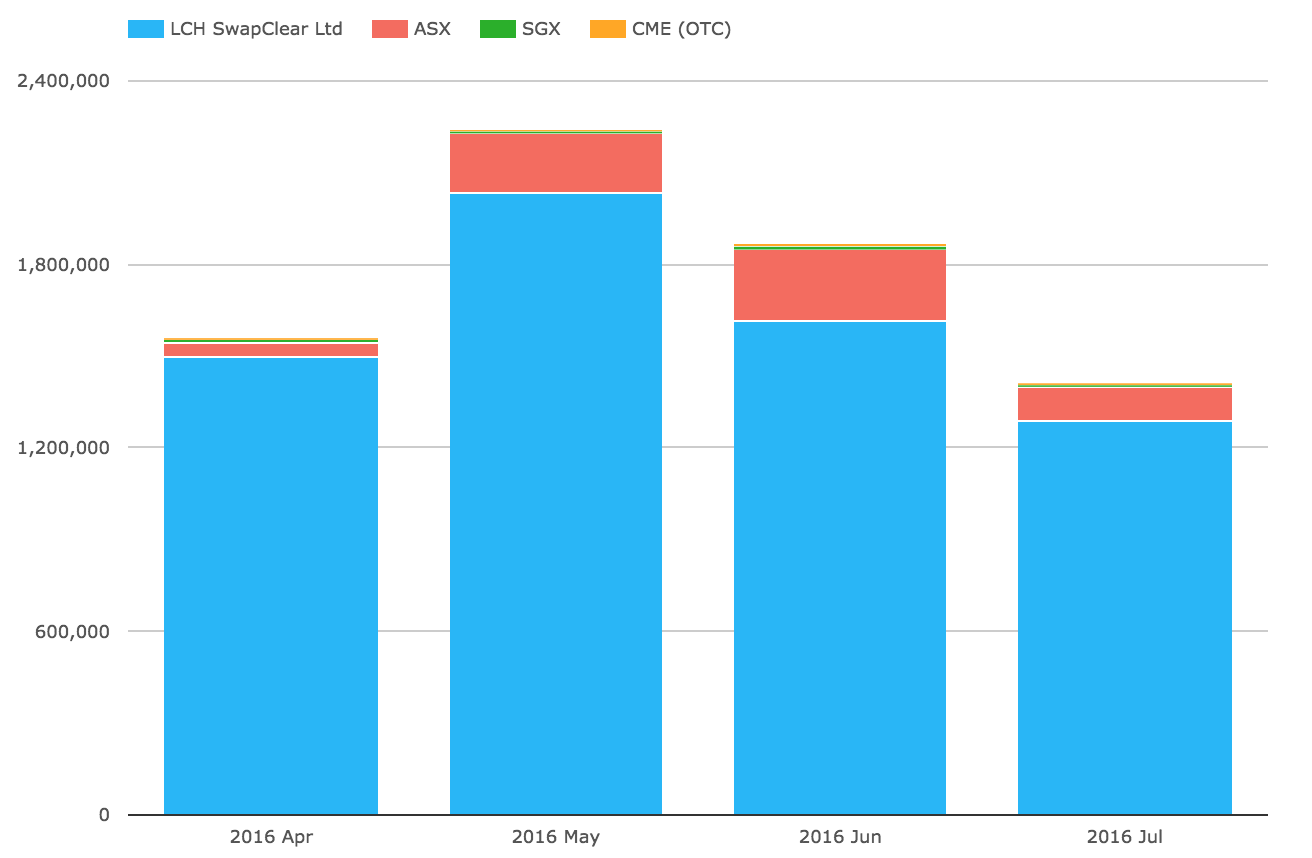
Showing:
- LCH SwapClear down to $1.3 trillion from the $1.6 trillion in June
- ASX at $111 billion, down from $234 billion in June
- CME at $6.7 billion, down from $7.7 billion in June
- SGX at $6 billion, down from $11 billion in June
Second the volume of MXN and BRL Swaps.
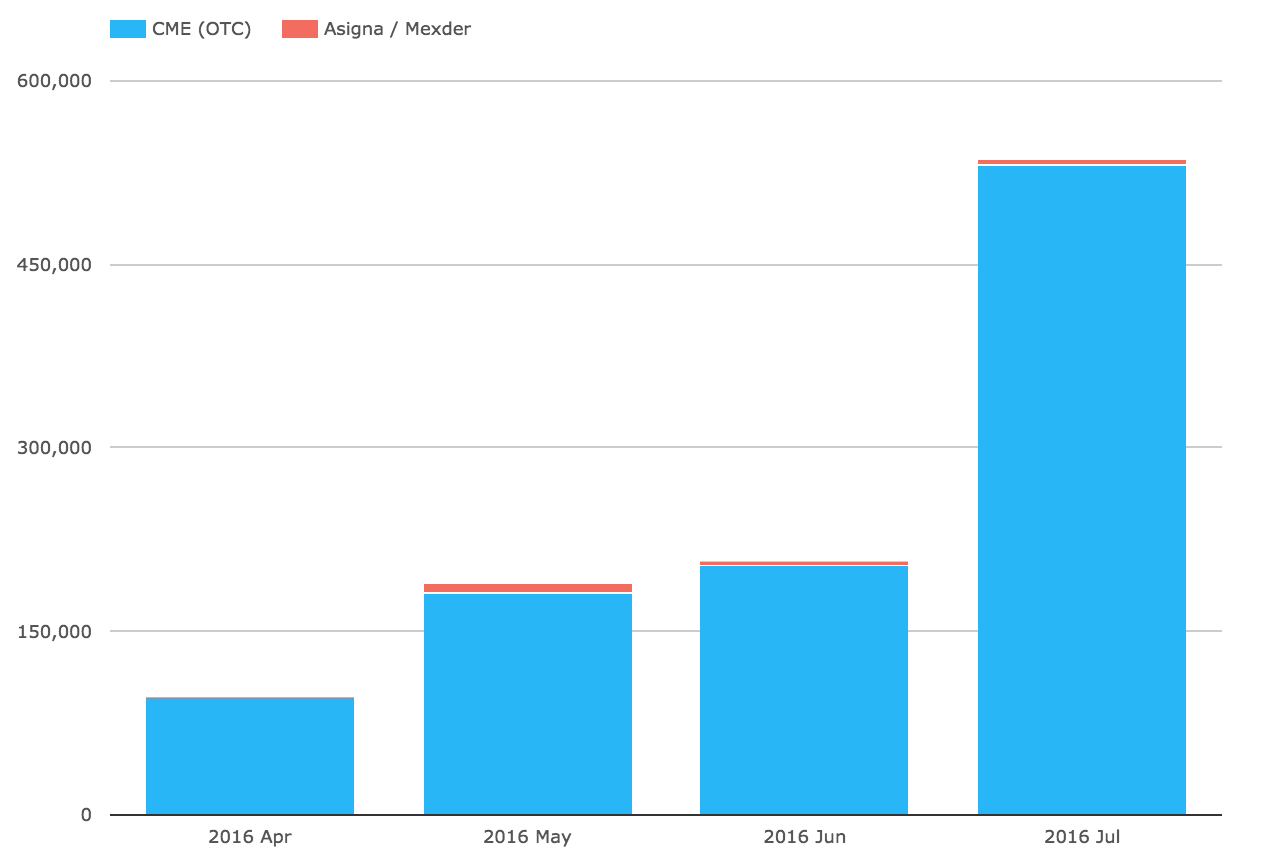
Showing:
- CME with $530 billion in July, up from $200b in June
- Driven by $490 billion of MXN IRS, up from $170 billion
- With BRL IRS up to $41 billion from $36 billion (the first month of clearing)
- Asigna / Mexder also showing with $5.5 billion in July
That’s it for today.
Thanks for staying to the end.
Our Swaps review series is published monthly.