- Libor OIS spreads have been widening.
- Trading volumes across these products have also shown a spike in activity.
- We look at price-volume charts and DV01 figures for OIS swaps.
- We also update our CHF SARON OIS volumes, where a total of CHF37.5bn has now traded versus this new index.
Libor OIS Spreads
Last week, it seemed impossible to look at financial news without mention of widening Libor-OIS spreads:
- Measure of US borrowing costs flashes amber ($)
- Fed Takes a Back Seat for Traders Focused on Libor’s Big Blowout
- U.S. three-month LIBOR/OIS spread widens beyond 50 bps
- US borrowing costs spike raises alert
And of course, there were interesting threads on Twitter about it:
It’s remarkable how quarantined this move in USD LIBOR – OIS has been to date – no discernible carry over to xccy basis, FX, or risk in general. pic.twitter.com/aA65dkZGww
— Five Minute Macro (@5_min_macro) March 15, 2018
Not least this one:
Times change. Now it’s the Fx-ois swap not Xccy
— phyron (@parrmenidies) March 16, 2018
Everything in the domain seemed focused on the spot spread though. Any basis trader worth his salt will tell you that we are only really interested in forward spreads. Everything in the spot spread is already “priced-in”. We become worried when forward-looking instruments start pricing in lasting, long-term widening.
For this, the one year Libor-OIS spread is always worth looking at. Here’s a price-volume chart from our SDRView data:
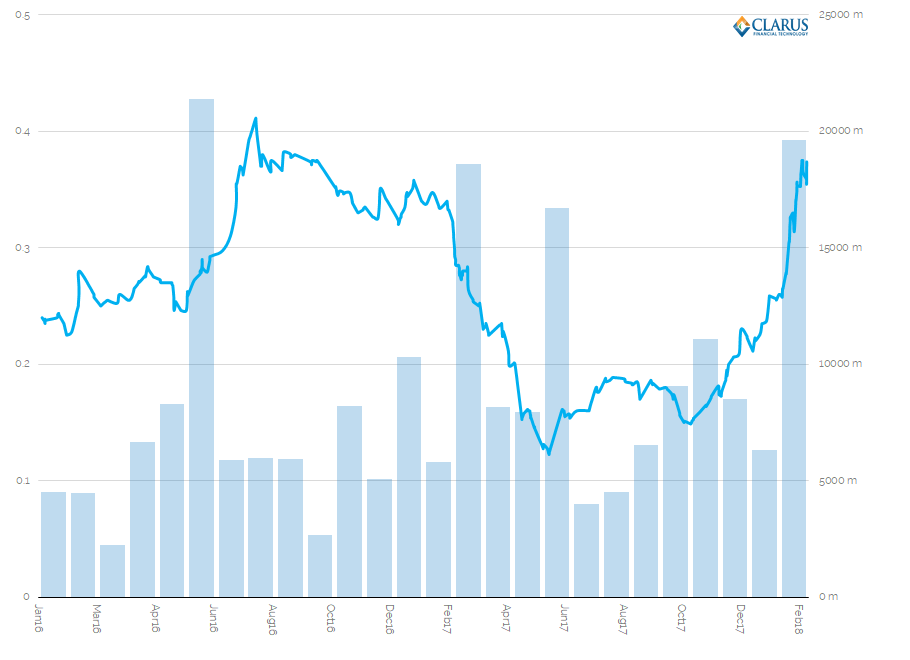
Showing;
- We are not even at the peaks seen from the last “storm in a tea-cup” with these spreads – aka money market fund reform. The 1 year Libor-OIS spread (Bloomberg ticker USBG1) was over 40bp back then. It’s always good to remember the themes that caused the previous blow-outs, so here is Blackrock from August 2016.
- According to this chart, the move higher in 2016 was very well telegraphed, with most volume happening before the mini blow-out.
- It is also unusual to be below 20 bp in this spread, so 2017 represented a very low spread level from which to start this widening move.
- Still, volumes were consistently high throughout February this year. Volumes were only previously higher during June 2016.
- The commentary in the FT article is pretty accurate – it doesn’t look like a panic, but still, wider spreads mean tighter credit conditions. That means somebody, somewhere is paying more to raise cash than before the blow-out.
Fortunately, our SDR data, our microservices, and our blogs all make this an easy trend to stay on top of.
OIS Volumes in DV01
We have added DV01 calculations for OIS swaps. This means that we can look at volumes across the whole curve, without short-dated, large notionals distorting the picture.
DV01 calculations are maturity-agnostic and reflect the actual risk of a trade.
Our previous chart showed the volumes for the 1 year USD spread trade. I wanted to look at OIS volumes across the whole curve. And across all of the major currencies:
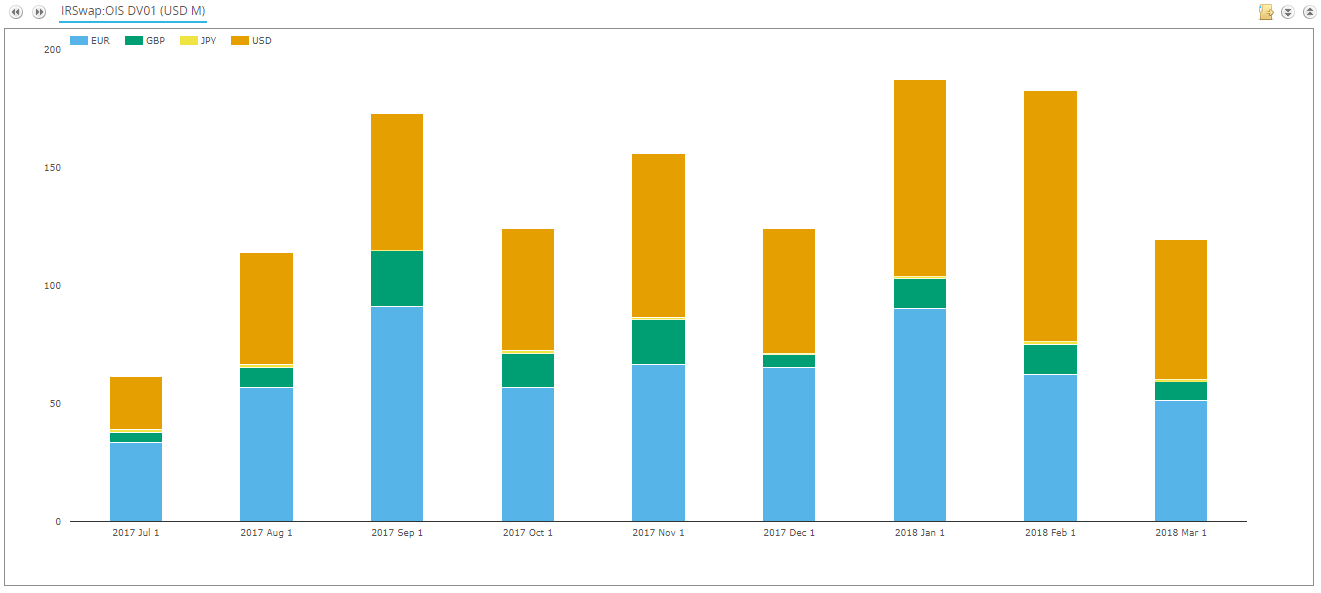
Showing;
- Monthly OIS volumes, measured in millions of DV01, across EUR, GBP, JPY and USD since July 2017.
- Volumes have been at recent highs in both January and February, with March so far (up to 16th) showing healthy volumes.
- Volumes are heavily concentrated in USD and EUR.
- USD saw particularly large volumes in February ($106m DV01), accounting for 58% of trading amongst OIS in these 4 currencies.
- EUR saw large volumes in January, at $90m DV01.
SDR data therefore suggests OIS volumes are currently elevated, if not quite at scary levels.
Global Cleared OIS Volumes
Due to the way CCPs report volumes, we cannot calculate DV01s in CCPView. However, we can still monitor the notional amounts of OIS being cleared:
Showing;
- Notional amounts of OIS cleared across EUR, GBP, JPY and USD.
- February saw large notional amounts being cleared, although short of the record month in March 2017.
- Nevertheless, February 2018 was the second largest month on record, with most of this in USD.
- Of particular note – volumes in Feb 2018 were 25% larger than the previous Libor-OIS blow-out in July 2016.
We started talking about BASIS at the start of this blog. These volumes are only for outright OIS swaps.
So let’s look at the Basis volumes reported by CCPs as well.
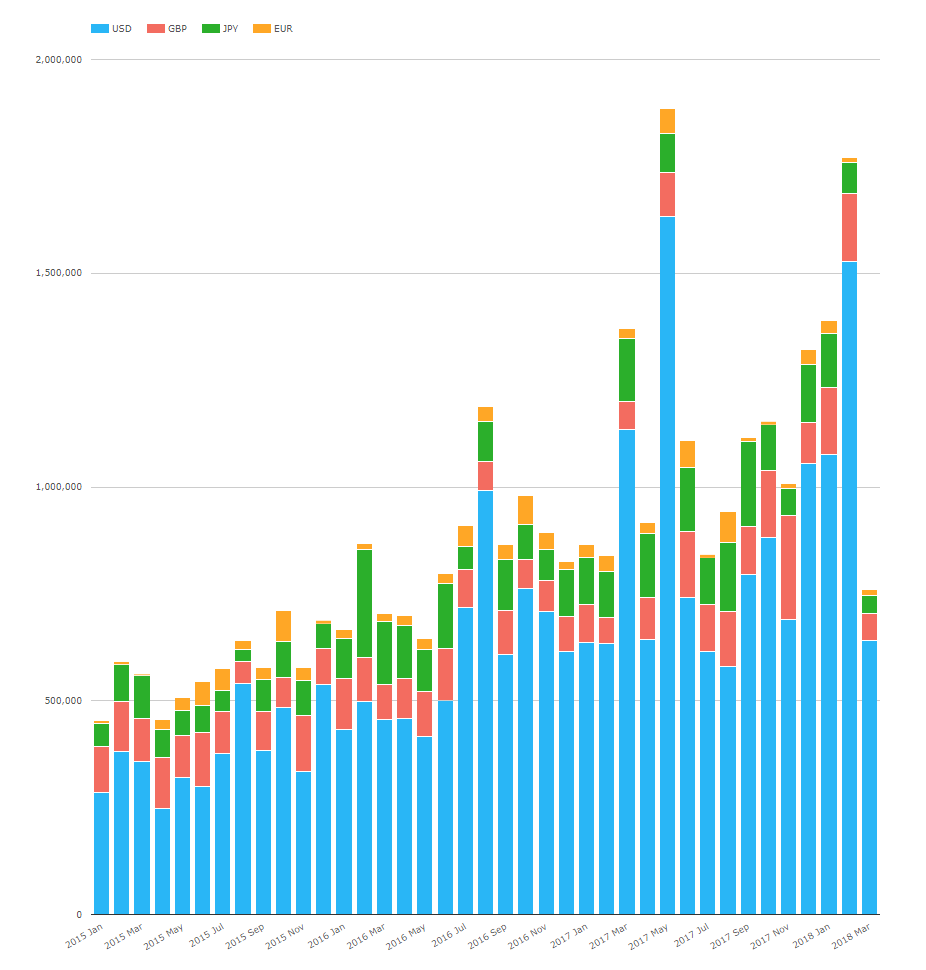
Showing;
- Global cleared basis volumes. These are single swap trades swapping from one floating index to another – eg. OIS vs Libor or 1 month Libor vs 3 month Libor.
- The vast majority of volumes are in USD products – because it has a thriving 1 month vs 3 month Libor market that doesn’t really exist in many other currencies.
- It is now far more capital efficient to trade these products as a single swap (a “basis” swap) rather than two outrights – because the leverage ratio grosses up notional on two outrights. Therefore we have seen more markets, such as EUR, starting to trade basis trades as a single trade rather than two swaps. This is good as it provides us with more transparent data.
- As we saw for outright OIS, the recent record month was in March 2017 (what happened exactly?!).
- Again, last month saw the second highest volumes on record.
Conclusions? Over our three or four charts, there doesn’t seem to be too much to worry about. But the combination of large volumes across outright OIS, basis swaps and increasing 1 year volumes in Libor-OIS just as spreads are widening does suggest nervousness and repositioning going on.
One to monitor rather than one to lose sleepless nights over. Unless you are known as “Mr Basis Point” I guess….
And Finally…
We can’t talk about OIS and not mention benchmark reform, the demise of Libor and RFRs. Therefore, here are the latest SARON cleared volumes:
Showing;
- Volumes have continued to increase since our previous update in December. Daily volumes have reached over CHF3.5bn, all at LCH.
- CHF SARON is still not a daily traded product, but monthly volumes were over CHF13bn in January. They have since dropped back to ~CHF5bn.
I was also interested to see how much further CHF SARON Open Interest had to go in order to recover the peaks reached by CHF TOIS:
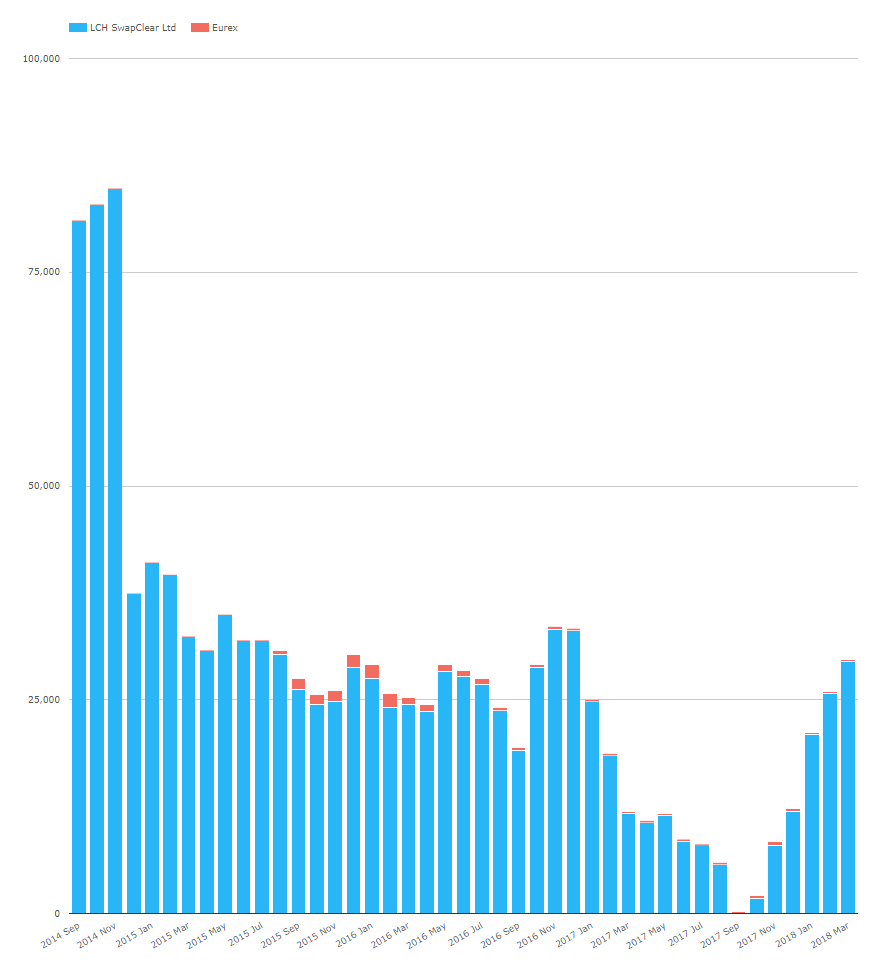
The previous peak in 2014 was nearly CHF85bn. We now stand at just shy of CHF30bn. After ~3 months of trading, we are therefore 35% of the way to previous Open Interest records. That is pretty impressive from a zero base! It bodes well for other RFRs in the future…..
In Summary
- The widening in Libor-OIS spreads has been accompanied by elevated volumes across OIS and Basis trading.
- Volumes have not been this high since March 2017 and are higher than the previous basis blow-out in Summer 2016.
- OIS trading now accounts for over $150m DV01 of risk traded each month across the four major currencies.
- CHF SARON trading has now topped CHF37.5bn since the demise of TOIS last year.
what is the libor ois spread as of today? is it still in the upper trend?
Hi Michael;
New blog just published as an update. Please see https://www.clarusft.com/libor-ois-march-2018-update/