We are now getting our hands dirty with new public transparency data. Amir has covered this in a couple of blogs recently, and I have also used the Russian Federation CDS data from SBSDRs.
For this blog, we’ll look in more detail at Total Return Swap data for Equities.
What Is a Total Return Swap?
First off, this being a Clarus blog, I should at least attempt to explain what a Total Return Swap is. I am sure we are all familiar by now with IRS, OIS, FRAs…. but TRS? Perhaps some readers would benefit from a refresher:
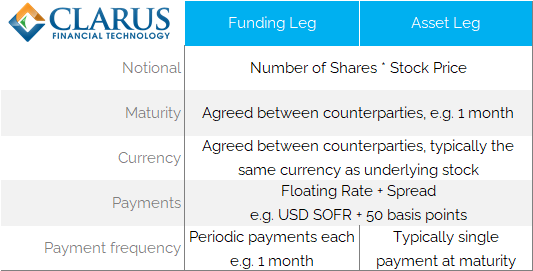
This is pretty neat if you think about it. Imagine you are sat at a highly leveraged hedge fund, and your fund charges you 500 basis points over SOFR as your funding cost. You used to work at a bank, where you could fund yourself at 50 basis points over SOFR. Why wouldn’t you call up your old desk buddies at your old bank and say – “Can you borrow some money and buy Stock XYZ for me please? I’ll cover your funding costs and any downside on the stock price, and you pay me any of the upside”. You save yourself 450bp…..
Of course, the trading desk will be taking on credit risk, for which they will be charging you. They’ll most likely want you to post daily margin to cash collateralise the position to reduce their credit exposure to you. Your fund will charge you SOFR + 500bp for the daily collateral amounts, but that is going to be only on a portion of the total notional amount. And if the trade goes your way, you’ll be receiving cash collateral off your old dealer buddies – your funding cost will be completely negated on a winning trade. Nice.
Looked at this way, TRS can work against any underlying. The dealer buys bonds, indices, single stocks, bitcoin etc and puts it on their balance sheet, paying along the return of the asset to an investor (or vice versa if an investor wants to short a stock and doesn’t want to borrow it to do so). The dealer will of course charge investors for the cost of holding these assets on its balance-sheet (they will be converted into risk weighted assets and capital held against them). But that is a discussion for another time.
Data Tools
Clarus now have two tools to interrogate the public transparency data on total return swaps.
Our SBSDR web-based application:
And our microservices-based API:
At this early stage, I find I am using both tools equally. It is really helpful to have access to both when getting comfortable with the data.
Most Active Stocks
I went in it to this analysis expecting to see Tesla, Apple and recently Twitter top of our trading charts. I couldn’t be more wrong.
As Amir highlighted, there are a few teething problems with the data, such as:
- Trades being reported with currency “USD”, but the amounts reported in local currency. This leads to a lot of Asian ISINs topping simple charts.
- Trades missing maturity dates. How is this even possible? Are the reporting counterparties sure these are TRS 😛
- No information on the funding leg – missing indices, spreads etc. This needs some more investigation.
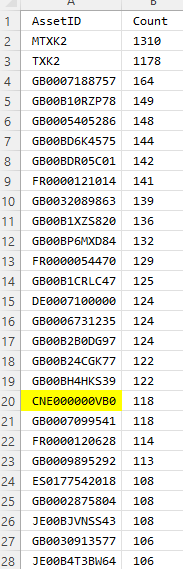
However, simply by sorting the data by both trade count and notional I can get a reasonable grid of “most active” stocks in the TRS market.
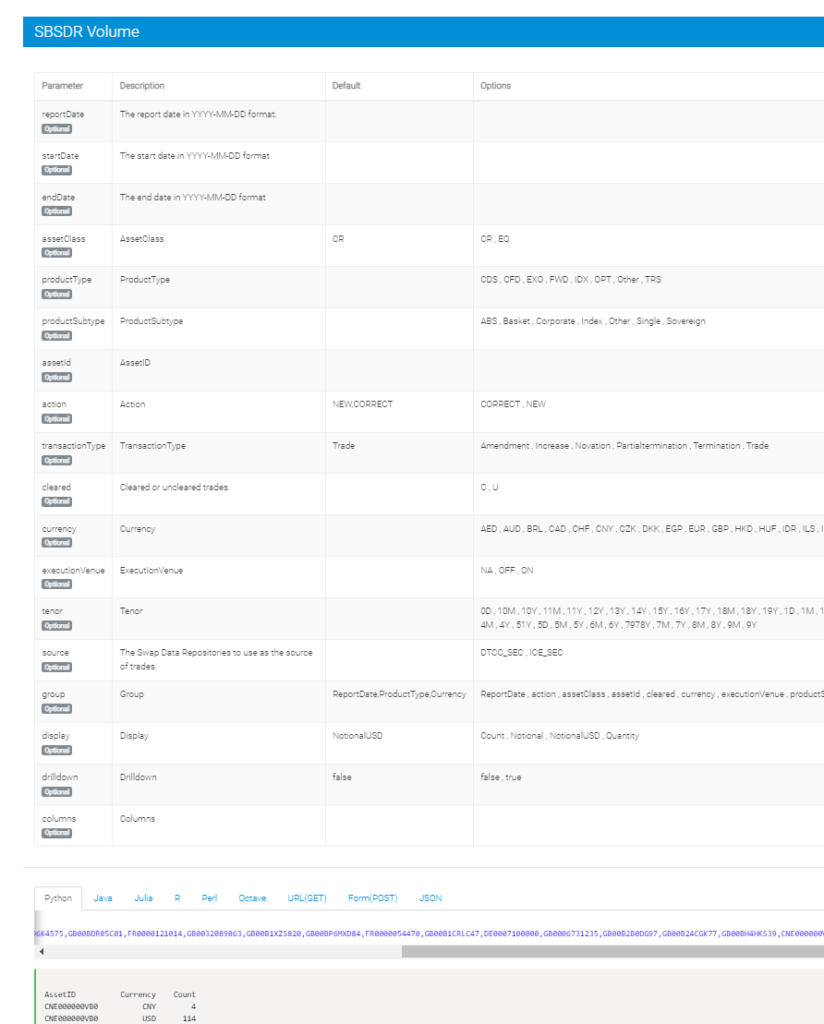
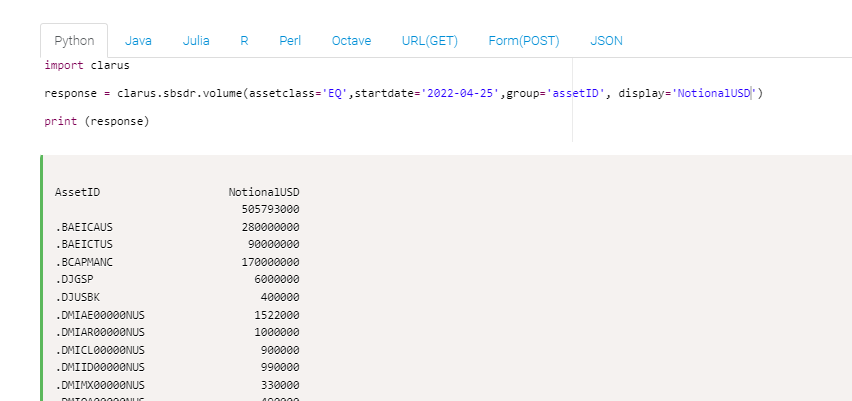
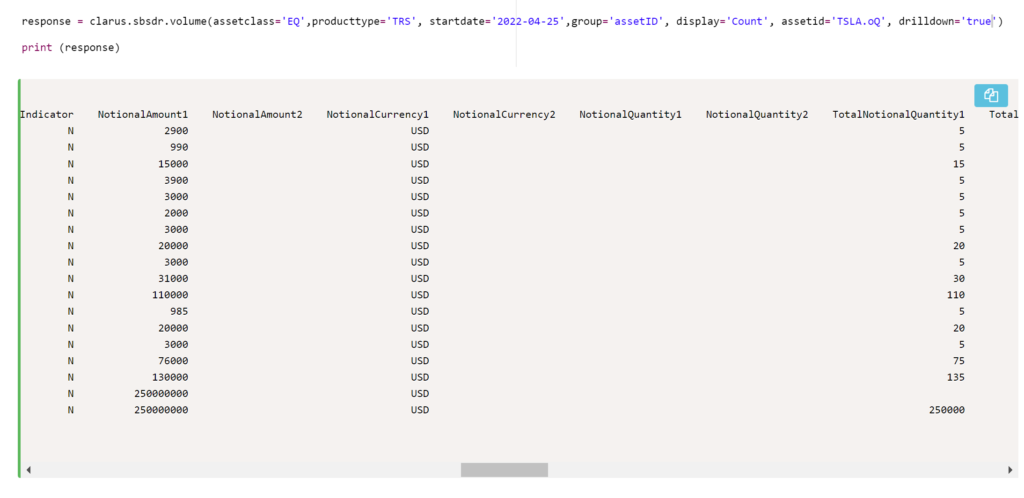
First, I run a single line of code to look at trade counts:
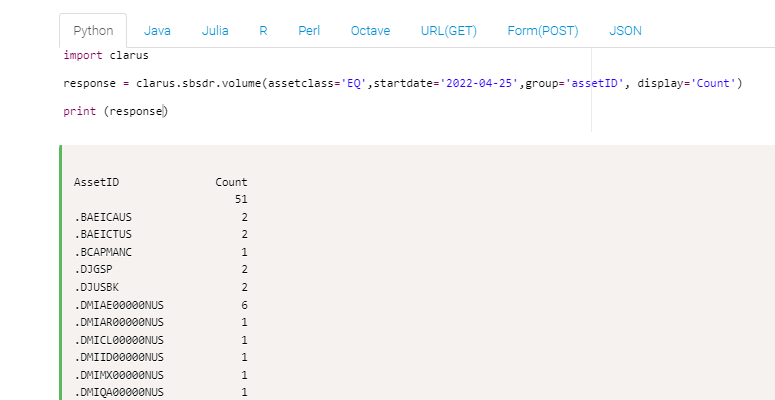
Then I run the same query, but instead return Notional Equivalents in USD:
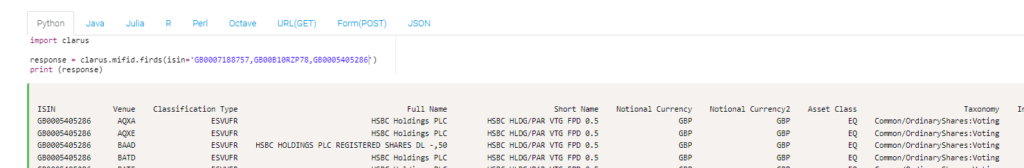
With not too much messing around, I can then join those two tables to look at activity by trade count and trade notional. I then send the 30 most active securities to our microservice that deciphers ISIN identifiers:
Three pretty straight-forward calls and I am in a place to make sense of the data.
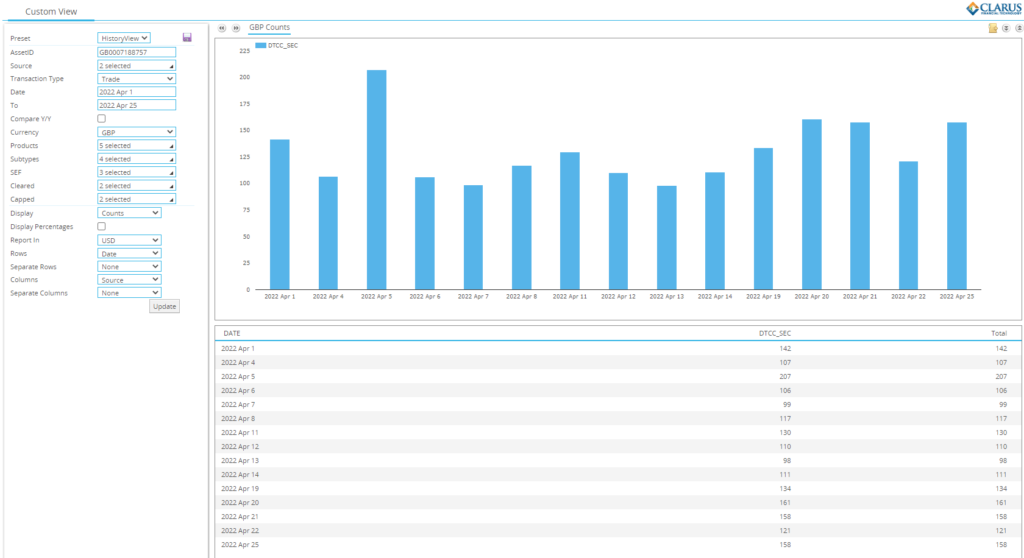
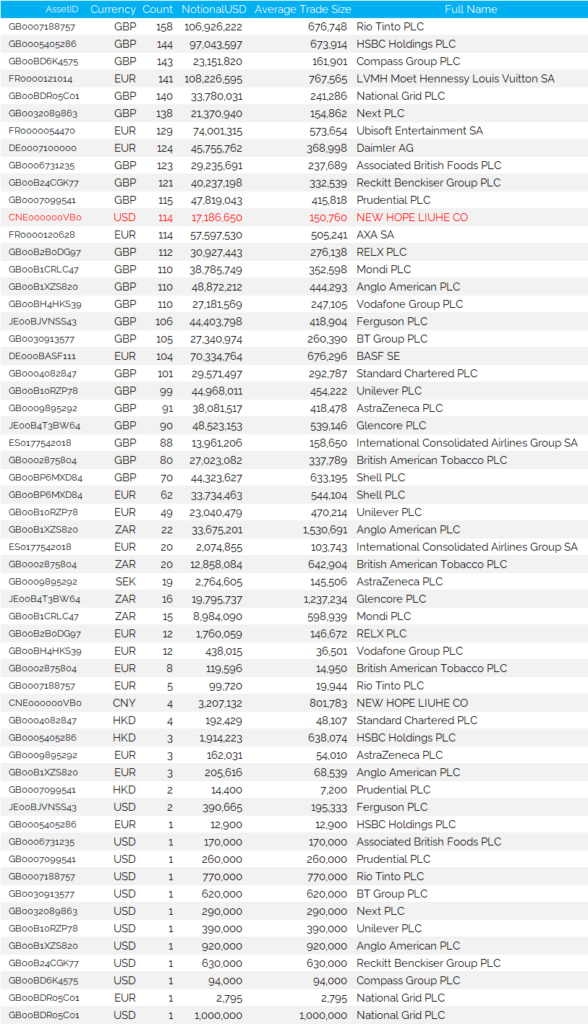
Have a look below for 25th April activity:
What is wrong with the data so far?
Whilst the above table looks all nice and respectable, it does take some work to get there. We still have a few issues with the data.
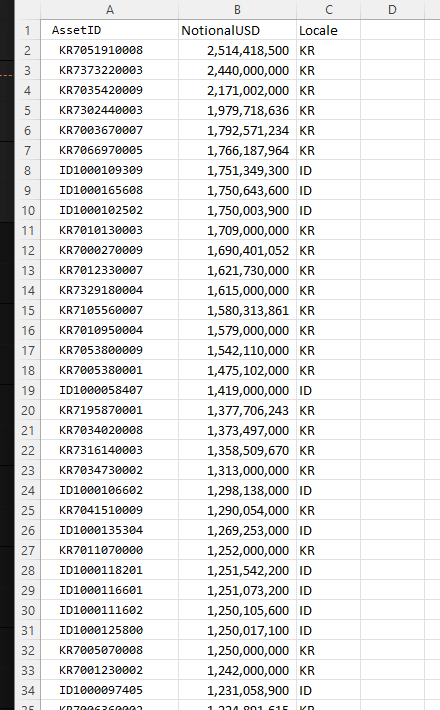
First off, as Amir mentioned, all of the $Billion+ USD notionals reported are almost certainly reported in local Asian currencies, not USD:
Whilst the most active trades by trade count make far more sense:
As an example of where this data can take you, I went down some interesting rabbit holes! ISIN “HK0000449303” was reported as trading $370m in notional on 25th April. On my Bloomberg terminal, I see this is “Wing Yip Food”. At first thought, you might think this Equity TRS caused the price spike below!
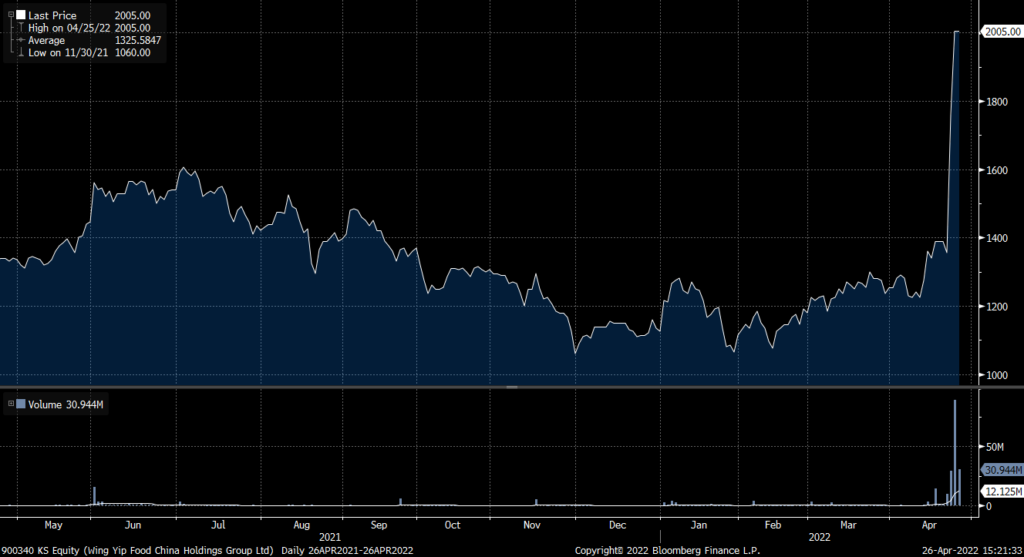
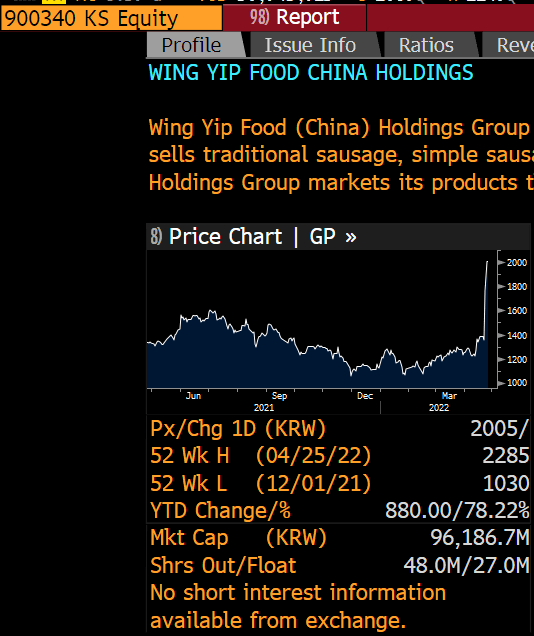
However, a little digging suggests that this trade was far more likely reported in the wrong currency, as the entire Market Cap is only $77m (KRW96bn)!
The activity from the SBSDR does not necessarily help explain the massive spike in price, but it’s not everyday you find a stock in Bloomberg that spiked by 50% in a single day!
What Does The Clean Data Show?
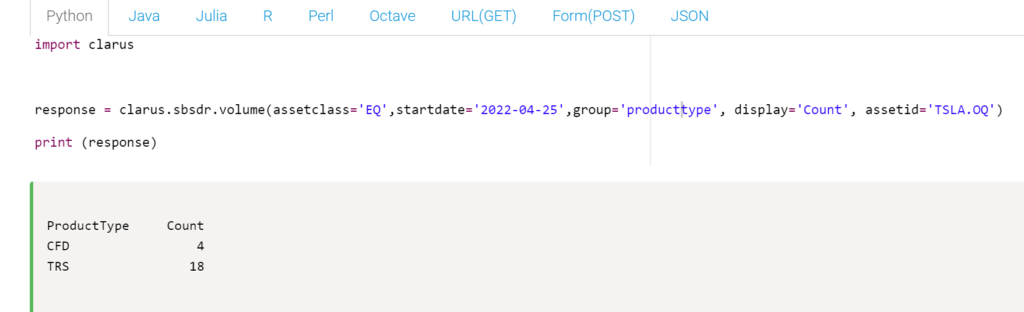
Amazingly, I find no US listed stocks in the top 30 most active stocks. TSLA was reported as trading a total notional of $502m (which we have doubts about – see below), but it “only” traded 22 times. Small trade numbers compared to the 100+ that trade versus European names:
Interestingly, most TRS are reported versus an ISIN. The most active CFDs are reported versus a RIC code. Is there a structural reason there I wonder?
Most importantly, in terms of our cleansed data:
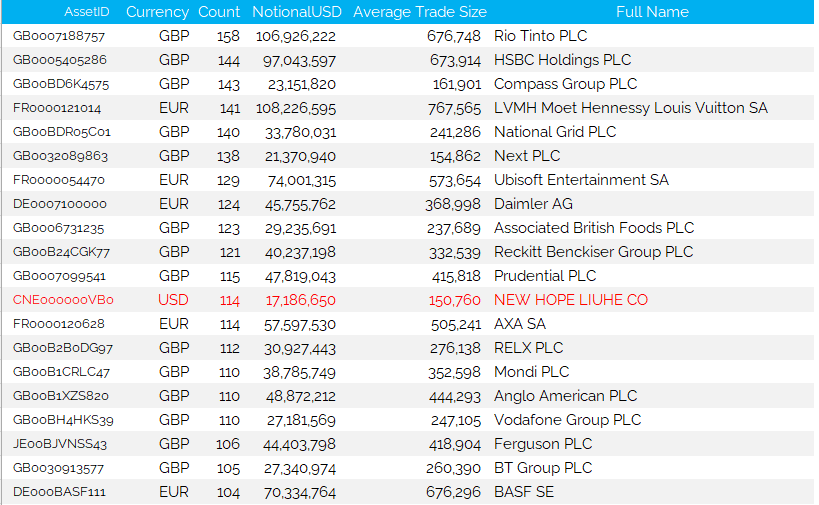
Showing;
- All of the most active stocks, as measured by trade count, are European.
- There is only one stock, New Hope Liuhe, denominated in USD. There is plenty of reading to be done on this stock if you are not familiar with it –> Bloomberg Billionaires.
- The rest are some of the most recognisable names in the European stock markets, with many of them UK listed.
- Average trade sizes are anywhere from $150k up to $750k+.
Which brings us on to the TSLA data. The headline figures – 22 trades, $500m+ of notional – suggests that this name trades in much larger size. The reality is that the figures appear severely skewed by two trades of $250m+ notional! Are these real or bad data? Most probably bad data unfortunately.
Our campaign to cleanse the the data, and make the source data accurate, begins here. It needs to be better so that transparency improves.
In Summary
- There is a lot of data now being reported on Equity TRS out of the new SBSDRs.
- Some of the data is quite obviously wrong and this needs to improve as counterparties get used to transaction reporting.
- However, it is relatively trivial to cleanse the data and make it usable even in the current state.
- It is notable that the most active names all appear to be European.
- We look forward to continuing to analyse this novel data.