
This blog looks at the market shares of customer segregated margin (customer seg) of US-regulated derivatives clearing brokers (FCMs) at the end of Q2 2026.
Key takeaways
At the end of Q2 2026, the biggest year-on-year (YoY) market share changes were as follows.
- 4.1% of FCM swap customer seg was given up by Morgan Stanley (MS), Goldman Sachs (GS), Citigroup (Citi), and Wells Fargo (Wells), while 4.0% was picked up by Barclays, BNP Paribas (BNP), and Deutsche Bank (DB).
- 4.6% of FCM futures customer seg was given up by JP Morgan (JP), MS, and GS, while 2.6% was picked up by Barclays and Bank of America (BofA) and 2.1% was picked up by ten other non-US banks.
- Non-bank brokers’ share of FCM futures customer seg was flat while Marex and Interactive Brokers picked up a combined 0.4% from the all the other brokers. Stonex migrated clients from R.J. O’Brien which it acquired in 2025.
- The almost uniform US-to-non-US bank swing might suggest differences in regulation or accounting regime by region of HQ were a factor (for example, Basel III endgame impacting FCM incentives differently by region of HQ). Views please.
- Read on for the supporting analysis.
Clearing broker market shares
Derivatives client clearing brokers make most of their revenue from ticket fees and margin spread. Rates for ticket fees and margin spread can vary even by individual client within an FCM. Nonetheless, shares by FCM of market trade counts and market client IM balances might be reasonable proxies for shares by FCM of market revenues from ticket fees and margin spread.
Unfortunately, client trade counts by FCM are not publicly available. However, total client IM balances are publicly available from the futures customer seg and swap customer seg balances by FCM which are published monthly by the CFTC. We would also expect a correlation between margin balances (customer seg) and ticket counts, provided we can bar extreme distributions of client trading approaches by FCM (for example, one FCM has only clients which trade risk flat, while another has only clients that trade buy and hold).
In short therefore, shares of FCM customer seg balances are a reasonable though imperfect proxy for shares of US clearing broker revenue. Clearly non-US clearing brokers are separate.
Swap customer seg balances
We chart swap customer seg balances by G14 bank-owned FCM.
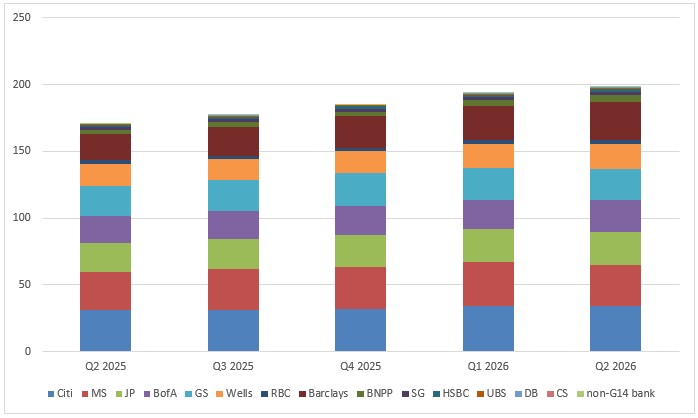
Chart 1: quarter-end FCM swap customer seg by FCM (USD billions). Source: CFTC, author analysis
Chart 1 shows swap customer seg of $199 billion at the end of Q2 2026 – up 16.5% YoY and up 2.6% QoQ.
- The seven largest FCMs (six from the US plus Barclays) each had visibly more seg than all other G14 banks combined.
- The seven made up about 93% or $184 billion of swap customer seg.
- I included non-G14 bank FCMs as a combined group, though you’ll have to take my word for it – their combined total of $329 million of swap customer seg is barely visible at this scale.
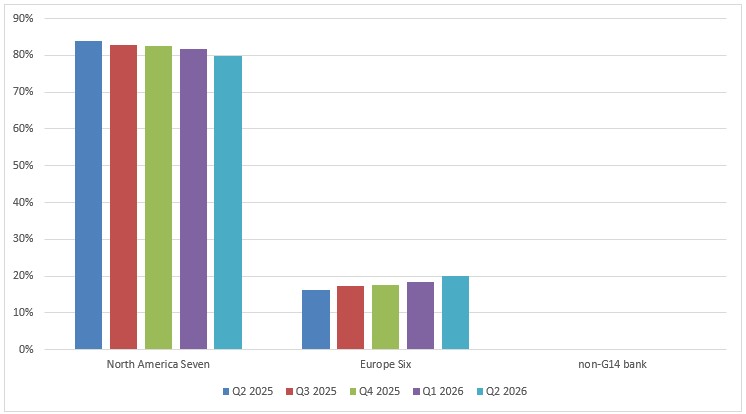
Chart 2: quarter-end FCM swap customer seg share by FCM group (percentage of swap customer seg requirement). Source: CFTC, author analysis
Chart 2 groups together the FCMs into the “North America Seven” bank-owned FCMs, the “Europe Six” bank-owned FCMs and “non-G14 bank” FCMs. The missing G14 bank is Credit Suisse (CS), which withdrew from FCM clearing in 2021 (before the merger with UBS).
By the end of Q2 2026:
- The North America Seven had a share of 79.7% to the Europe Six’s 20.1%.
- For four quarters straight, the North America Seven gave up share (totaling 4.1% YoY) and the Europe Six gained share (totaling 4.0% YoY).
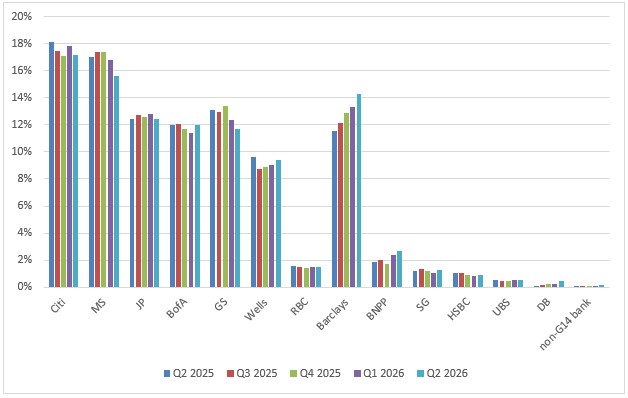
Chart 3: quarter-end FCM swap customer seg share (percentage of swap customer seg requirement). Source: CFTC, author analysis
Chart 3 breaks out Chart 2 to individual G14 FCM and non-G14 bank FCMs as a group and shows that the seven largest FCMs each exceeded 9% and totaled 92.5% share at the end of Q2 2026.
The North America Seven’s 4.1-point YoY share reduction noted under Chart 2 broke out as follows:
- MS gave up 1.5 points for a share of 15.6%.
- GS ceded 1.4 points for 11.7%.
- Citi yielded 1.0 points for 17.1%.
- Wells let go 0.2 points for 9.4%.
- JP, BofA, and RBC were individually and collectively flat with a combined share of 25.9%.
The Europe Six’s 4.0-point YoY share increase noted under Chart 2 broke out as follows:
- Barclays gained 2.8 points for 14.3%.
- BNP added 0.8 points for 2.7%.
- DB put on 0.4 points for 0.4%. (DB had its first non-zero swap customer seg balance in February 2025 since withdrawing from FCM clearing in 2017.)
- Société Générale (SG), HSBC, and UBS were individually and collectively flat with a combined share of 2.7%.
To summarize the three charts, 4.1% of FCM swap customer seg was given up by Morgan Stanley (MS), Goldman Sachs (GS), Citigroup (Citi), and Wells Fargo (Wells), while 4.0% was picked up by Barclays, BNP Paribas (BNP), and Deutsche Bank (DB).
Futures customer seg balances
We can do a similar analysis on exchange traded derivatives customer segregated margin requirements (futures customer seg), which are included in the same CFTC monthly data.
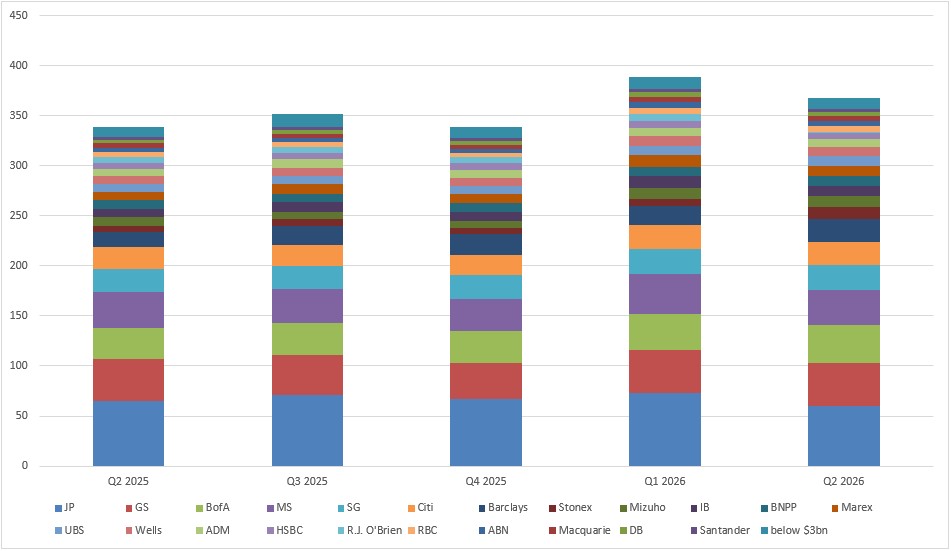
Chart 4: quarter-end FCM futures customer seg by FCM (USD billions). Source: CFTC, author analysis
- Chart 4 shows that customer futures seg declined to $368 billion at the end of Q2 2026 – up 8.5% YoY but down 5.4% QoQ. Like swap customer seg: the seven largest FCMs are each much bigger than the other FCMs (with SG substituted for Wells in the seven-bank list). Unlike swap customer seg:
- The largest seven FCMs had lower combined share of 67% or $247 billion of futures seg.
- Ten further bank-owned FCMs and four brokers each exceeding $3 billion and combined were 30% or $98 billion of futures seg.
- FCMs below $3 billion totaled 2.8% or $11 billion of futures seg.
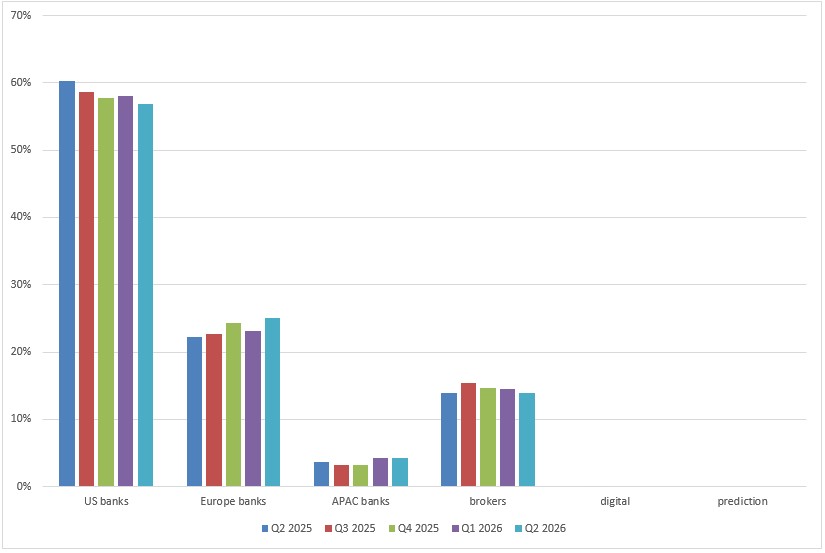
Chart 5: quarter-end FCM futures customer seg share by FCM group (percentage of futures seg requirement). Source: CFTC, author analysis
Chart 5 shows material shares of futures customer seg for FCM groups not in swap customer seg, namely Asia Pacific (APAC) banks and non-bank brokers. YoY share changes were as follows:
- US banks’ futures seg share declined to 56.8% (smaller than swap customer seg) – down 3.4%.
- Europe banks’ share increased to 25.1% (bigger than swap customer seg) – up 2.9%.
- APAC banks had 4.2% – up 0.6%.
- Brokers had 13.8% – flat.
- Digital brokers (Coinbase) had 0.039% – up 0.017%.
- Prediction markets firms (Fanduel and Performance Predictions combined) had 0.000014% – up from zero.
- In summary, US banks gave up 3.4% of futures seg YoY with Europe banks adding 2.9% and APAC banks taking 0.6%.
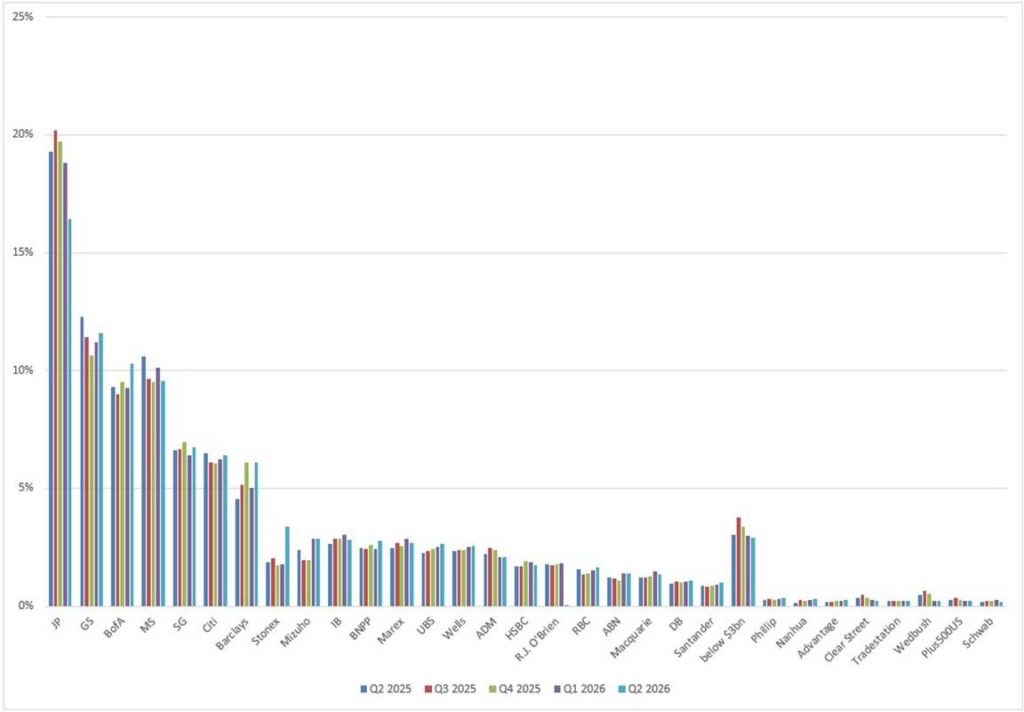
Chart 6: quarter-end FCM customer futures seg requirement share showing the five-quarter trend (percentage of futures seg requirement). Source: CFTC, author analysis
Chart 6 shows that in Q2 2026 the seven largest FCMs each had more than 6% share and were collectively down 2.0 points YoY to 67.1%, which broke out as follows:
- JP was down 2.8 points to 16.4%.
- MS was down 1.0 points to 9.5%.
- GS was down 0.7 points to 11.6%.
- Citi was down 0.1 points to 6.4%.
- Barclays was up 1.6 points to reach 6.1%.
- BofA was up 1.0 points to 10.3%.
- SG was up 0.1 points to 6.7%.
A further ten bank-owned FCMs with above $3 billion futures seg rose by a combined 2.0 points to 19%.
To summarize the banks on all three charts, 4.6% of FCM futures customer seg was given up by JP Morgan (JP), MS, and GS, while 2.6% was picked up by Barclays and BofA and 2.0% was picked up by ten other non-US banks.
Within the flat brokers share move noted under Chart 5:
- Marex was up 0.24 points to 2.7%.
- Interactive brokers (IB) increased 0.18 points to 2.8%.
- Stonex – was up 1.5 points to 3.4% in the Stonex entity while R.J. O’Brien entity was down 1.7 points to 0.04%. This suggests Stonex largely completed the migration of clients from the entity it acquired in 2025.
In summary, brokers’ combined share of FCM futures customer seg was flat while Marex and Interactive Brokers picked up a combined 0.4% from other brokers. Stonex migrated clients from R.J. O’Brien which it acquired in 2025.
End note
Six charts covered the CFTC published FCM seg balances and FCM market share in depth.
Skip back to the top to reread the key takeaways if you like.