
This blog is the Q2 2026 edition of our regular blog on US-reported rates swaps compression.
Key takeaways
- Q2 2026 saw cleared core swap compression volumes of $45.7 trillion notional – up 19% year-on-year (YoY) but down 18% quarter-on-quarter (QoQ).
- Compared with Q2 2025, D2C platforms (TradeWeb and Bloomberg) took a further 5.9% share of US-reported compression volumes mainly from off-platform compression.
Scope and data context
As it was for the prior blog, our scope is US-reported compression of cleared “core” rates swaps, which we define to include OIS, fixed float IRS, and basis swaps and therefore excludes FRAs, swaptions, inflation swaps, and cross-currency swaps.
- Cleared FRA compressions are in fact new FRAs generated by vendor multilateral reset optimizations (MRO) as covered by our recent MRO blog.
- Uncleared swaption compressions are mostly generated by multilateral rates IMO (IMO) runs’ as per last year’s IMO blog.
- Cleared inflation swap compressions are an insignificant percentage of inflation swaps activity (though dominated by OSTTRA Reset). I will add to the next MRO blog.
- Uncleared cross-currency swap compressions are an insignificant percentage of cross-currency swaps activity. I will add to the next cross-currency swaps blog.
- Compressions not reported to US SDRs at all (and therefore excluded here) include:
- Multilateral vendor compressions, whose volumes are reg. reported to APAs by the vendors instead of to SDRs by the participants.
- CCP blending and netting, whose volumes are reported on CCP websites and not reported to regulators.
As context, here are core swaps volumes with compressions in the context of other package types.
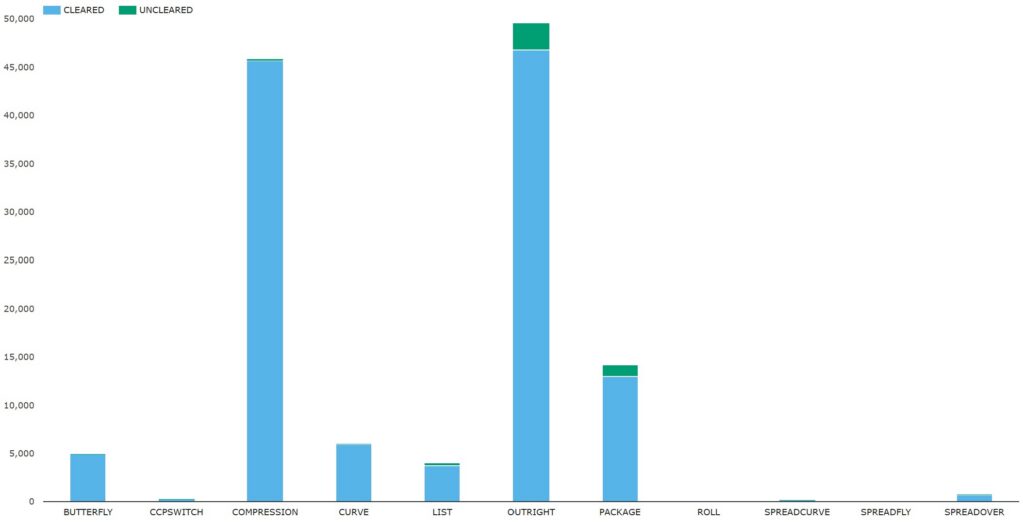
Chart 1: Q2 2026 US-reported core rate swap volumes by package type (notional USD billions). Source: SDRView
Chart 1 shows that cleared compressions were $45.7 trillion, only slightly less than cleared outright trades of $46.8 trillion, while other package types made up the remaining $28.7 trillion.
If you open the prior blogs, it may help to keep them open for further reference as you read on.
Cleared OIS and fixed float IRS compression
We include both cleared OIS and fixed float IRS to cover all fixed float trades together.
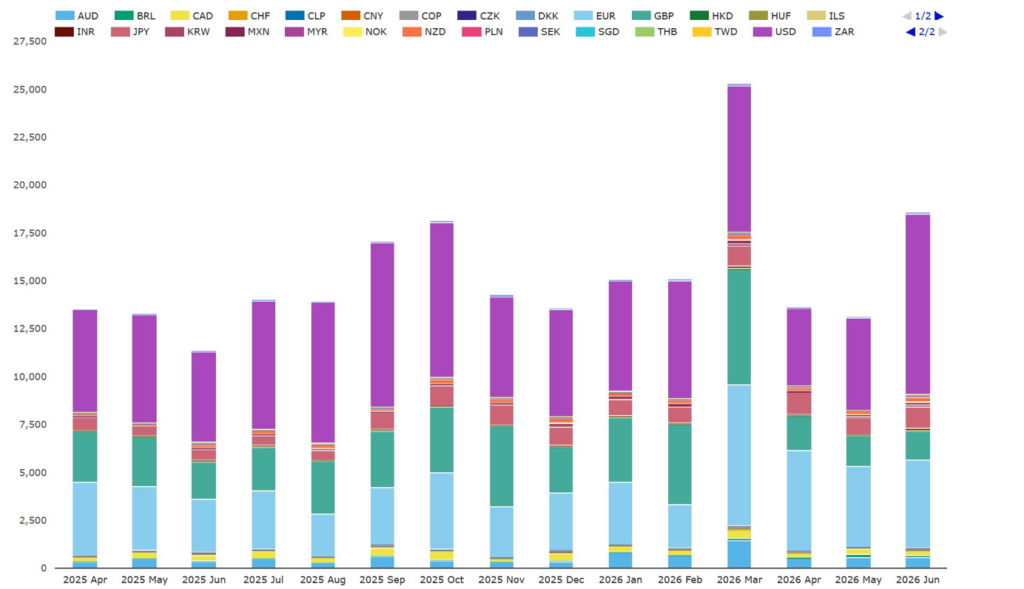
Chart 2: US-reported cleared OIS and fixed float IRS compression volumes by currency (notional USD billions). Source: SDRView
Chart 2 shows no month in Q2 2026 approaching the record volumes in March of $25.3 trillion. Aggregating by quarter, Q2 2026 saw $45.3 trillion – up 19% YoY from $38.1 trillion in Q2 2025 but down 18% from the Q1 2026 record of $55.4 trillion. There was compression activity in 28 currencies.
The top seven currencies were 95.3% of the total or $43.2 trillion – up 18% YoY but down 19% QoQ.
- USD was the largest with $18.3 trillion – up 16% YoY but down 6.5% QoQ.
- EUR was next with $14.0 trillion – up 41% YoY.
- GBP was next with $4.89 trillion – down 32% YoY.
- JPY had $3.09 trillion – up 99% YoY.
- AUD had $1.64 trillion – up 42% YoY but down 44% QoQ.
- CAD had $756 billion – down 6.5% YoY.
- NZD had $521 billion – up 136% YoY.
- The next five currencies were 2.4% of the total or $1.07 trillion – up 66% YoY but down 6.8% QoQ.
- BRL was up 219% with $270 billion.
- MXN was up 59% with $298 billion.
- KRW was up 60% with $175 billion.
- INR was up 27% with $139 billion.
- ZAR was up 23% with $186 billion.
- The remaining 16 currencies were 2.3% of the total or $1.06 trillion – up 11% YoY but down 5.4% QoQ. The fastest growing five currencies in this group were:
- MYR, which was up 461% with $34.4 billion (MYR only began clearing at LCH SwapClear in April 2025).
- COP, which was up 41% with $71.7 billion.
- NOK, which was up 38% with $92.7 billion.
- CLP, which was up 32% with $70.6 billion.
- CZK, which was up 31% with $87.6 billion.
- Remaining currencies – SEK, PLN, CNY, CHF, HUF, SGD, THB, ILS, HKD, TWD, and DKK – combined were down 1.1% with $701 billion.
Cleared basis swap compression
We look at month-by-month volumes by currency.
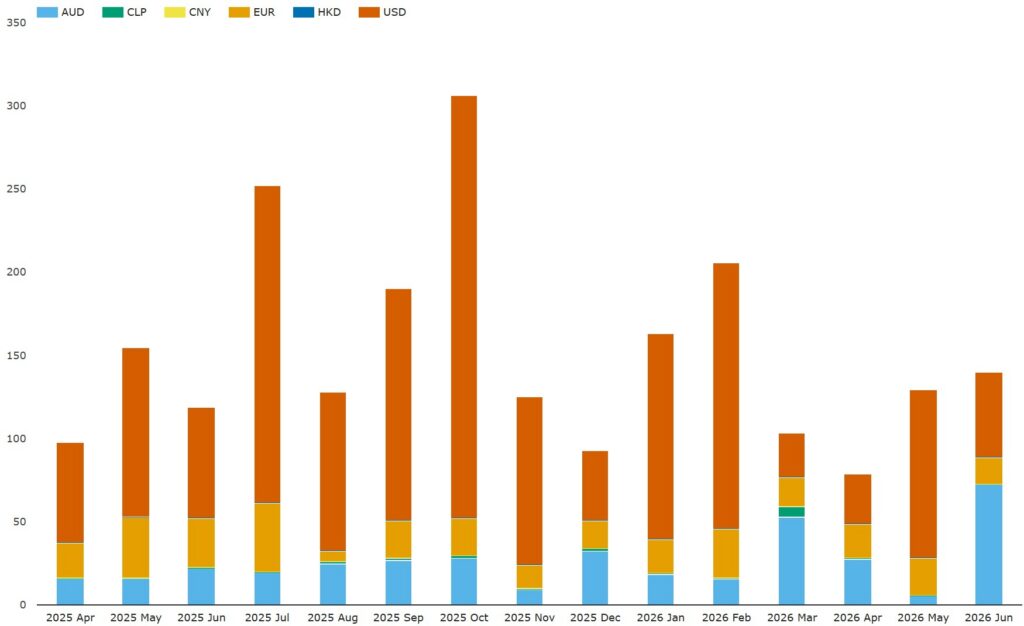
Chart 3: US-reported cleared basis swap compression volumes by currency (USD billions). Source: SDRView
Chart 3 shows the currency breakdown of cleared basis swap compression volumes. Aggregating by quarter, Q2 2026 saw $349 billion of cleared basis swap compression volume – down 6.2% YoY and down 39% from the Q3 2025 record of $570 billion. Only three currencies had material volume:
- USD FedFunds versus SOFR swaps had $183 billion – down 20% YoY and down 57% from the Q3 2026 record of $426 billion. 32% YoY.
- AUD BBSW versus AONIA swaps or BBSW payment frequency swaps had $105 billion a new high – up 102% YoY and up 21% from the Q1 2026 record of $87.1 billion.
- EUR Euribor versus EONIA swaps or Euribor payment frequency swaps had $58.1 billion – down 34% YoY from the Q2 2026 record of $88 billion.
If you expected EUR volumes to be higher than AUD volumes it may help to note that EUR basis hedging mainly uses opposing pairs of OIS (EONIA) and IRS (Euribor) whose volumes are buried in the prior section figures.
Note that SDRView subscribers can drill down to the volumes of the combinations of floating indexes.
Platform volumes and share
As context note that, while buy-side firms focus on D2C SEF compression for their portfolio cleanup, dealer banks focus on CCP and vendor compression (which are not reported to US SDRs) and supplement this with bilateral off-platform compression (which is US-reported). CCP compressions volumes are usually reported in summary on the CCPs’ websites. Vendor compressions are reported to regulators via an arranged publication arrangement (APA).
It may also help to note that D2C platform compressions are really portfolio transfers often from a buy-side firm to a dealer bank. Once the trade is in the dealer portfolio it may in turn be terminated via D2D platform compression, off-platform bilateral compression, CCP blending or vendor compression.
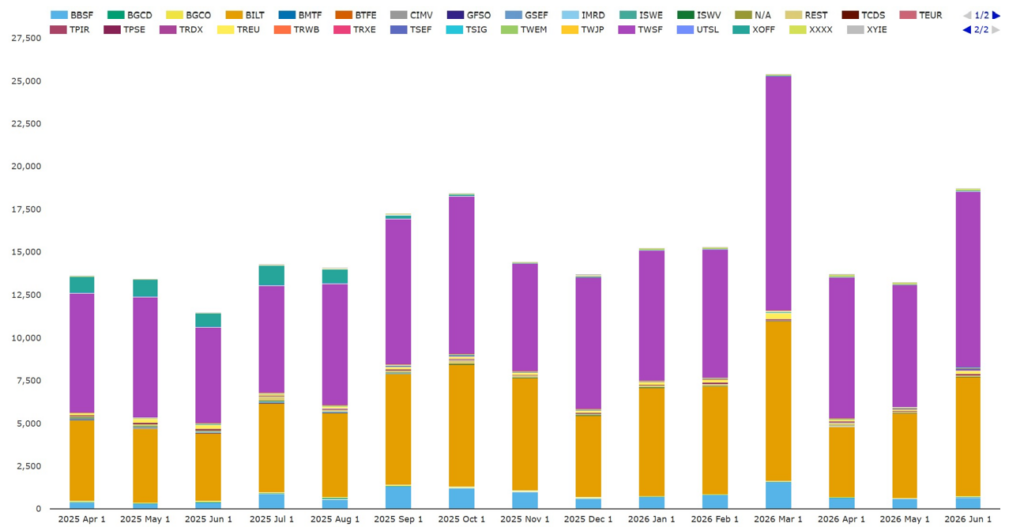
Chart 4: US-reported cleared core rate swap compression volumes by platform (percentage of USD notional). Source:
Aggregating by quarter and comparing YoY we see the $45.7 billion Q2 2026 volumes of cleared core swaps compression – up 19% YoY but down 18% QoQ.
- Tradeweb group (led by TWSF) saw core swaps compression of $26.3 trillion – up 29% YoY but down 12% QoQ.
- Bloomberg group (led by BBSF) was the only other D2C SEF compression platform group with $1.96 trillion – up 77% YoY but down 38% QoQ.
- Off-platform compression (led by BILT) had $16.6 trillion – up 4.5% YoY but down 26% QoQ.
- D2D compression platform groups (led by OSTTRA Reset, Tulletts and Trads) combined for a total of $771 billion – down 27% YoY but up 33% QoQ.
In summary, YoY Q2 2026 volumes grew in D2C platforms and off-platform but declined in D2D platforms.
Calculating market share percentages from the same data shows that in Q2 2026:
- Tradeweb group had a 57.7% market share – up 4.5 points YoY.
- Bloomberg group had 4.3% – up 1.4 points YoY but down 1.4 points QoQ.
- Off-platform had 36.4% share – down 4.9 points YoY.
- D2D platform groups had a total of 1.7% – down 1.0 points YoY but up 0.7 points QoQ.
To summarize, D2C platforms took 5.9% from off-platform and D2D platforms.
End note
- That is all for now. To recap the key takeaways, see the section near the top.
- We used four charts for a complete overview but there are many more reporting features and data in SDRView – click the link for a summary.
- Contact us for information on our data products, or for more details on any of the above analysis.