Clarus CCPView has daily volume and open interest (OI) data published by each CCP, which is filtered, normalized, and aggregated to allow meaningful volume comparisons.
This blog looks at single-sided gross notional volume in vanilla cleared rates swaps referencing IBORs and RFR indexes for quarter three (Q3) 2025 and the prior four quarters in all major currencies and regions.
Key takeaways:
Q3 2025 global notional volumes of vanilla cleared rates swaps were $245 trillion – up 15 percent quarter-on-quarter (QoQ), and up 19 percent year-on-year (YoY).
- USD OIS (Fed Funds, SOFR) set a record of $86.4 trillion – up 38 percent quarter-on-quarter (QoQ), and up 15 percent YoY.
- EUR IRS (Euribor) and OIS (€STR) combined totaled €50.2 trillion – down 14 percent QoQ, and down 7.3 percent YoY, and below the €70.3 trillion record set in Q1 2025.
- GBP OIS (SONIA) set a record of £30.1 trillion – up 21 percent QoQ, and up 63 percent YoY.
- JPY OIS (TONA) set a record of ¥2,990 trillion – up 27 percent QoQ, and up 34 percent YoY.
- AUD IRS (BBSW) and OIS (AONIA) combined totaled A$17.8 trillion – down 3.3 percent QoQ, but up 20 percent YoY, and below the A$ 19.9 trillion record, set in Q2 2025.
- CAD IRS (CDOR) and OIS (CORRA) combined set a record of C$9.81 trillion – up 35 percent QoQ, and up 70 percent YoY.
- EMEA IRS and OIS combined totaled $6.25 trillion – down 7.2 percent QoQ, but up 9.9 percent YoY.
- AsiaPac IRS and OIS combined set a record of $10.7 trillion – up 23 percent QoQ and up 31 percent YoY.
- LatAm IRS, OIS, and ZCS combined totaled $3.01 trillion – down 3.7 percent QoQ, and down 17.7 percent YoY.
Read on for supporting charts, detailed stats, and CCP market shares.
USD OIS (Fed Funds, SOFR)
Swaps referencing either Fed Funds or SOFR indices.
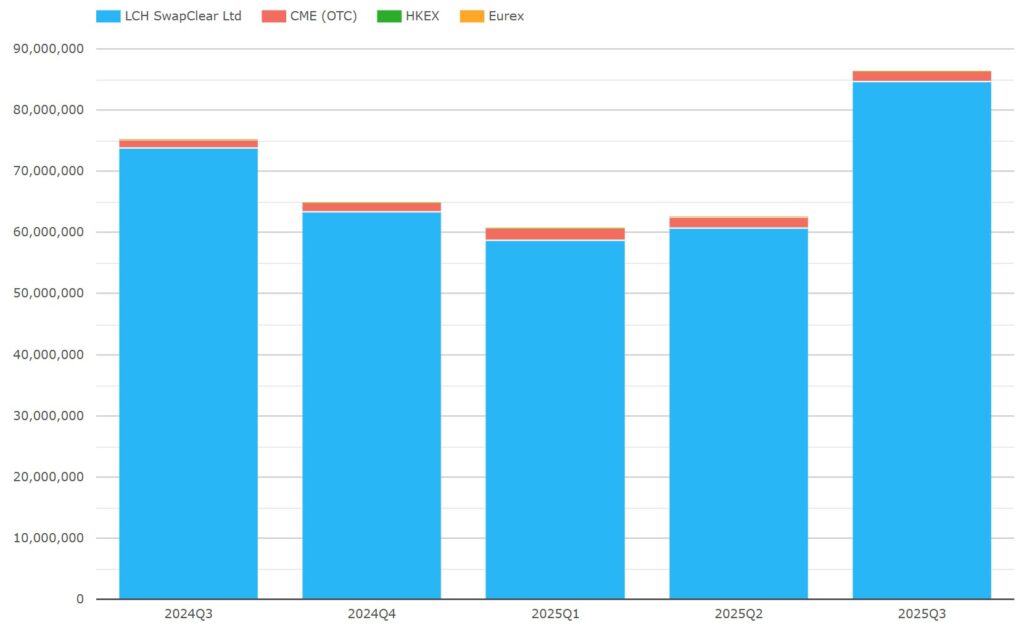
Chart 1: USD OIS single-sided gross notional in USD millions. Source: CCPView.
Chart 1 shows that, in Q3 2025, USD OIS totaled $86.4 trillion –up 38 percent quarter-on-quarter (QoQ), and up 15 percent YoY. This is a new record, beating the prior record of $75.2 trillion in Q3 2024.
- LCH SwapClear had $84.7 trillion – up 40 percent QoQ, and up 15 percent year-on-year (YoY). This is also a new record, exceeding the prior record of $73.8 trillion set in Q3 2024.
- CME OTC had $1.67 trillion – down 12 percent QoQ, but up 18 percent YoY.
LCH continues to dominate while CME’s market share was 1.9 percent – down from 3.0 percent in Q2 2025, but flat YoY. CME’s share of 3.5 percent in Q1 2025 was its highest share in the last four years.
EUR IRS (Euribor)
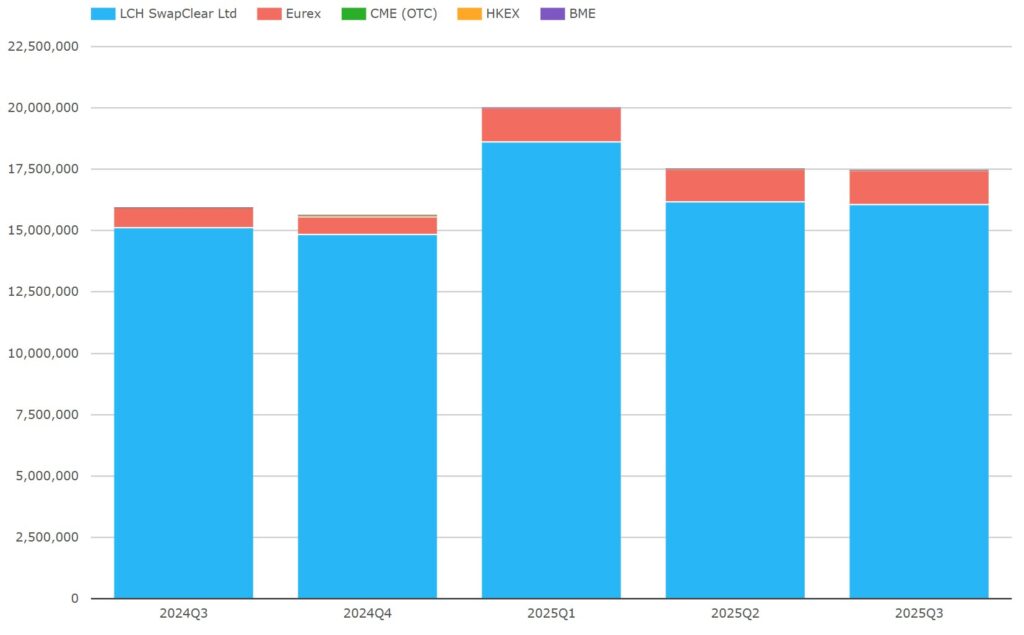
Chart 2: EUR IRS single-sided gross notional in EUR millions. Source: CCPView.
Chart 2 shows that, in Q3 2025, EUR Euribor IRS totaled €17.5 trillion, the second-highest quarter ever – down 0.3 percent QoQ, but up 9.5 percent YoY, though still below the record €20.0 trillion in Q1 2025.
- LCH SwapClear had €16.0 trillion – down 0.7 percent QoQ, and up 6.1 percent YoY.
- Eurex had €1.41 trillion – up 4.5 percent QoQ, and up 76 percent YoY.
LCH continues to lead market shares, while Eurex increased its market share to 8.1 percent – up from 7.7 percent QoQ and up from 5.0 percent YoY, though still below its record 10.0 percent, set in Q4 2020.
EUR OIS (€STR)
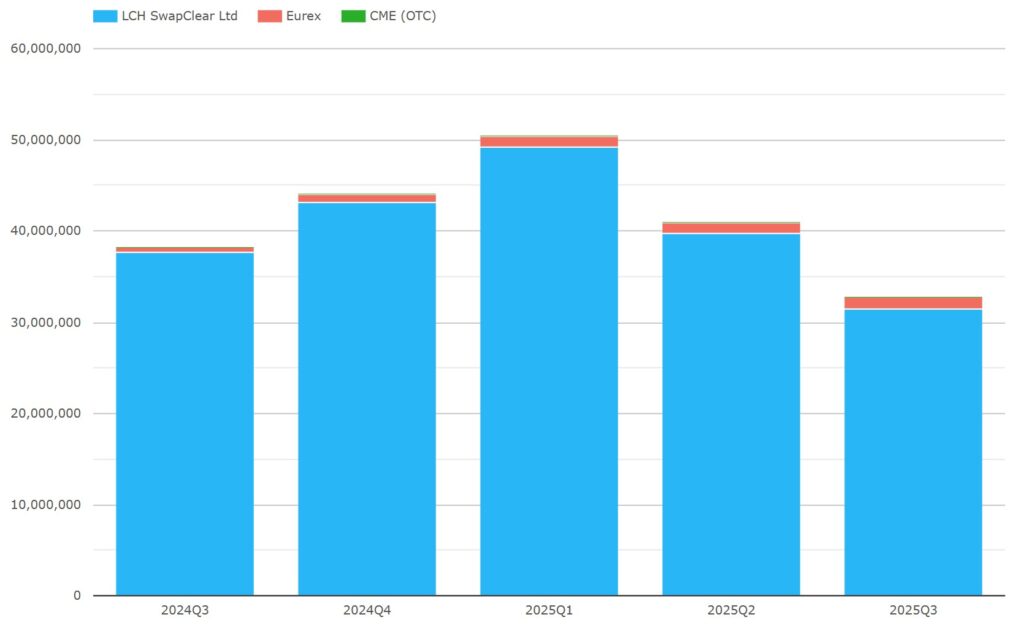
Chart 3: EUR OIS single-sided gross notional in EUR millions. Source: CCPView.
Chart 3 shows that, in Q3 2025, EUR €STR OIS totaled €32.8 trillion – down 20 percent QoQ, and down 14 percent YoY, far below the $50.3 trillion record set in Q1 2025.
- LCH SwapClear had €31.4 trillion – down 21 percent QoQ, and down 17 percent YoY.
- Eurex had € 1.4 trillion – up 14 percent QoQ, and up 145 percent YoY.
LCH continues to dominate but Eurex increased its market share to 4.3 percent – up from 3.0 percent QoQ, and up from 1.5 percent YoY, though still below its record 5.1 percent, set in Q3 2021.
The Eurex market IRS and OIS share increases include any impact so far of the ESMA Active Account Requirement (AAR), which went live at the end of Q2 2025.
The combined Q3 2025 EUR IRS and OIS volume declined to €53.2 trillion. At an FX rate of 1.17, this is equivalent to $62.2 trillion. This is now below the surging USD OIS volume of $86.4 trillion, though in Q2 2025 EUR exceeded USD.
GBP OIS (SONIA)
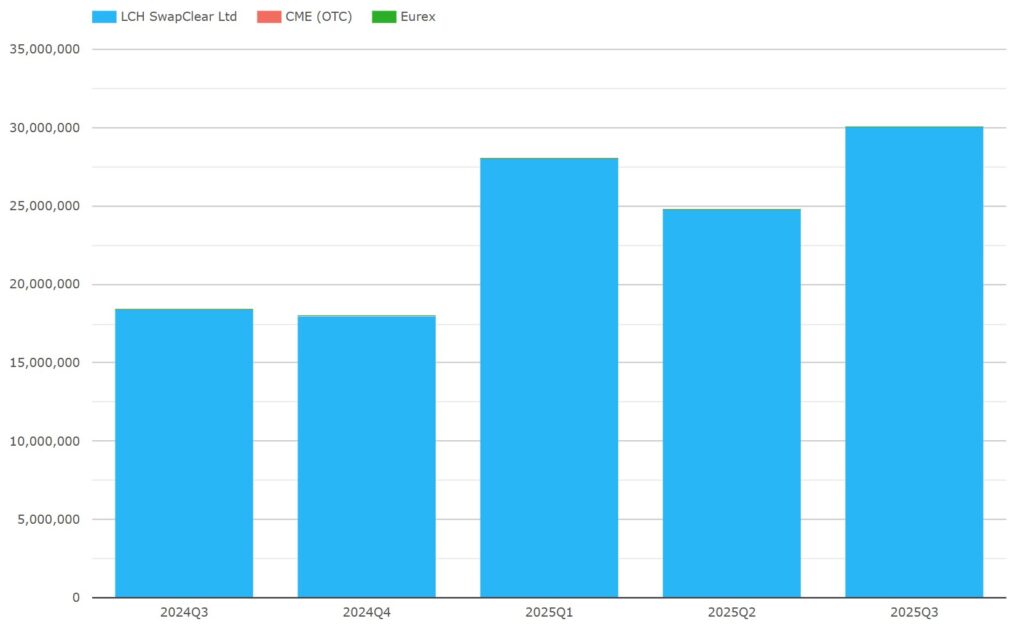
Chart 4: GBP OIS single-sided gross notional in GBP millions. Source: CCPView.
Chart 4 shows that, in Q3 2025, GBP SONIA OIS totaled £30.1 trillion – up 21 percent QoQ, and up 63 percent YoY. This is a new record, beating the previous record of £28.1 trillion set in Q1 2025.
LCH SwapClear had a 99.997 percent share.
At an FX rate of 1.3456, that £30.1 trillion total is equivalent to $40.5 trillion.
JPY OIS (TONA)
Note: we exclude the sustained small volume of JPY DTIBOR or ZTIBOR IRS – less than 0.3 percent of JPY swaps volume.
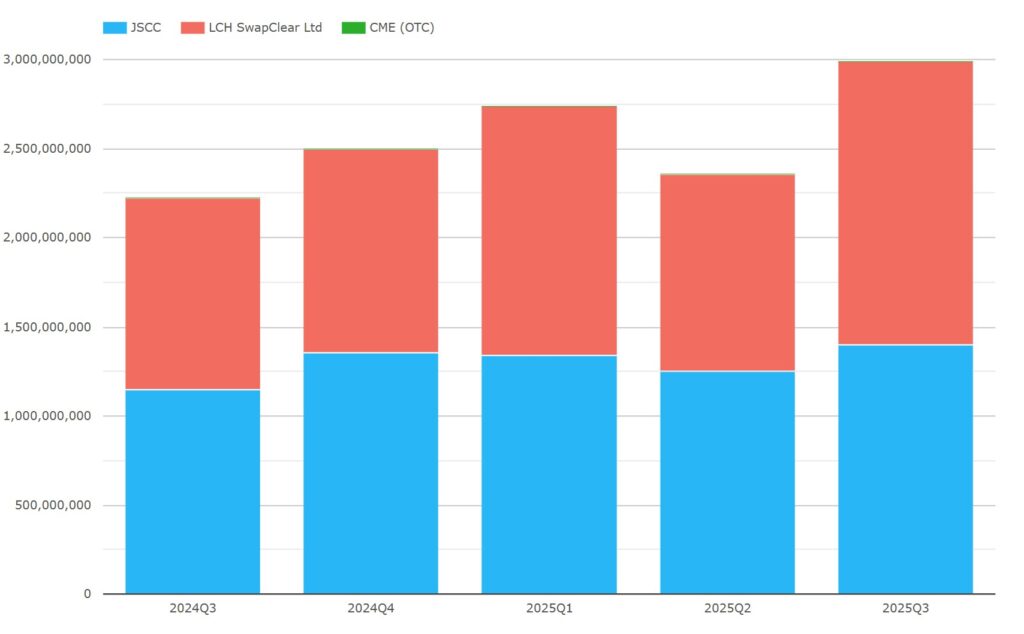
Chart 5: JPY OIS single-sided gross notional in JPY millions. Source: CCPView.
Chart 5 shows that, in Q3 2025, JPY TONA OIS totaled ¥2,990 trillion – up 27 percent QoQ, and up 34 percent YoY. This new record exceeds the previous high of ¥2,738 trillion in Q1 2025.
- LCH SwapClear had ¥1,590 trillion – up 43 percent QoQ, and up 48 percent YoY. This new record exceeds the previous high of ¥1,395 trillion in Q1 2025.
- JSCC had ¥1,400 trillion – up 12 percent QoQ, and up 22 percent YoY. This new record exceeds the previous high of ¥1,356 trillion in Q4 2024.
At an FX rate of 151, the ¥2,990 trillion total is equivalent to US$19.8 trillion.
As JPY is arguably the most competitive swap currency between CCPs, the market share is worth including a chart.
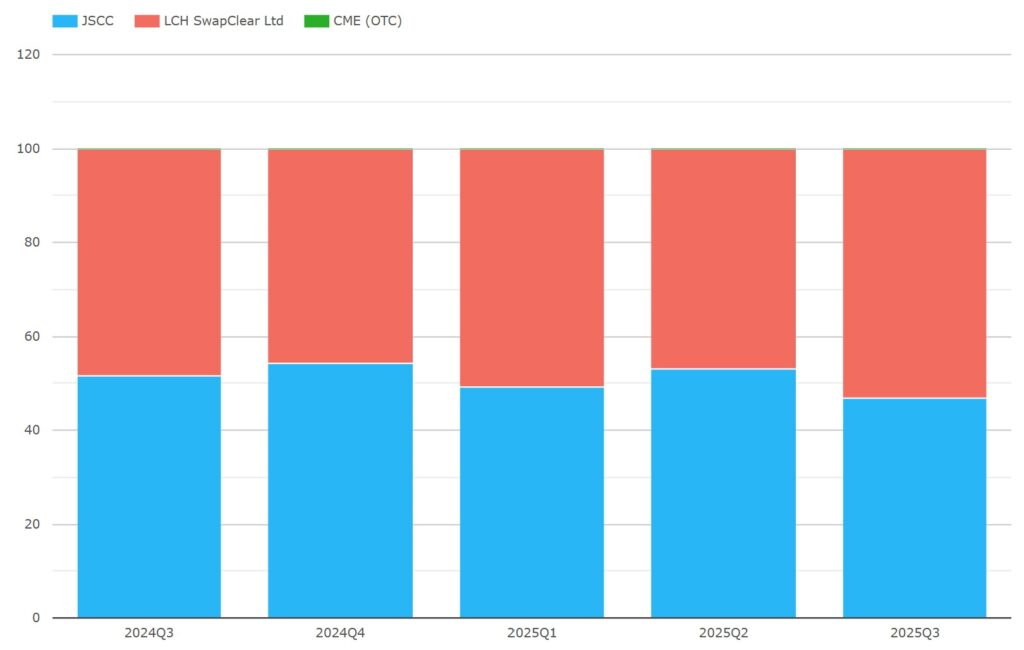
Chart 6: JPY OIS CCP notional share. Source: CCPView.
Chart 6 shows that the lead in JPY OIS market share changed hands in three of the last four quarters.
- LCH SwapClear took 53.2 percent in Q3 2025, 47.0 percent in Q2, 50.9 percent in Q1, 45.7 percent in Q4 2024, and 48.4 percent in Q3 2024.
- JSCC took 46.8 percent in Q3 2025, 53.0 percent in Q2, 49.1 percent in Q1, 54.3 percent in Q4 2024, and 51.5 percent in Q3 2024.
We looked at CCP share in our recent JPY swaps blog and noted that a surge has occurred in buy-side trading and in shorter tenors. Because the CFTC only recently enabled US buy-side firms to clear at JSCC, this surge may have favored LCH to the extent that the surge was disproportionately from US buy side firms. We will continue to watch this close competition in future editions of this blog.
AUD IRS (BBSW) and OIS (AONIA)
Here we combine IRS (BBSW) and OIS (AONIA).
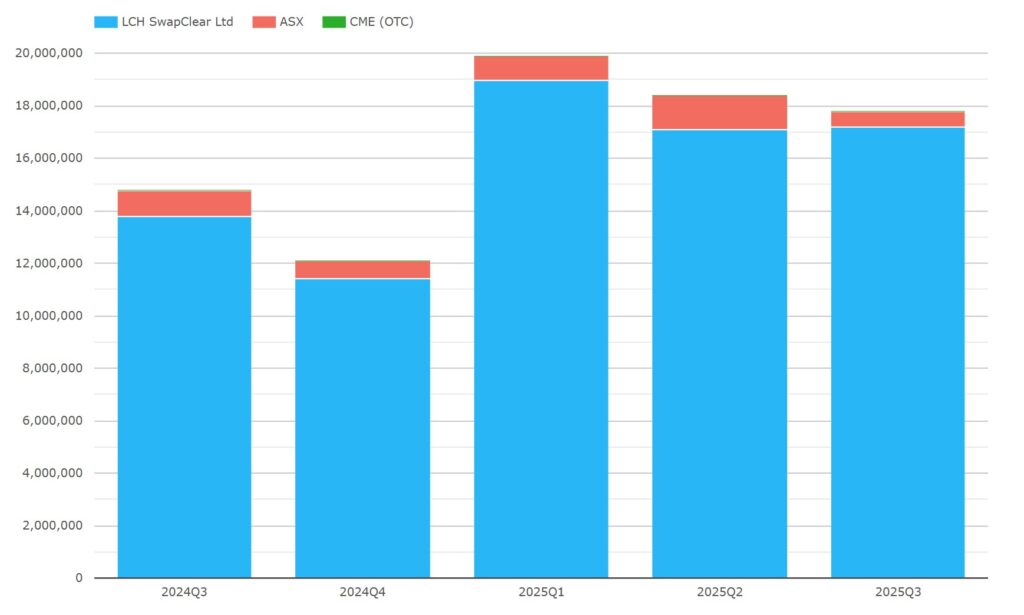
Chart 7: AUD IRS and OIS single-sided gross notional in AUD millions. Source: CCPView.
Chart 7 shows that, in Q3 2025, AUD IRS and OIS totaled A$17.8 trillion – down 3.3 percent QoQ, but up 20 percent YoY, while still below the record A$ 19.9 trillion, set in Q2 2025.
- LCH SwapClear had A$17.2 trillion – up 0.5 percent QoQ, and up 25 percent YoY.
- ASX had A$600 billion – down 54 percent QoQ, and down 40 percent YoY.
CCP market shares were LCH 96.6 percent and ASX 3.4 percent – down from 7.0 percent QoQ and down from 6.8 percent YoY.
At an FX rate of 1.51, the A$17.8 trillion total is equivalent to US$11.8 trillion.
CAD IRS (CDOR) and OIS (CORRA)
Here we combine IRS (CDOR) and OIS (CORRA).
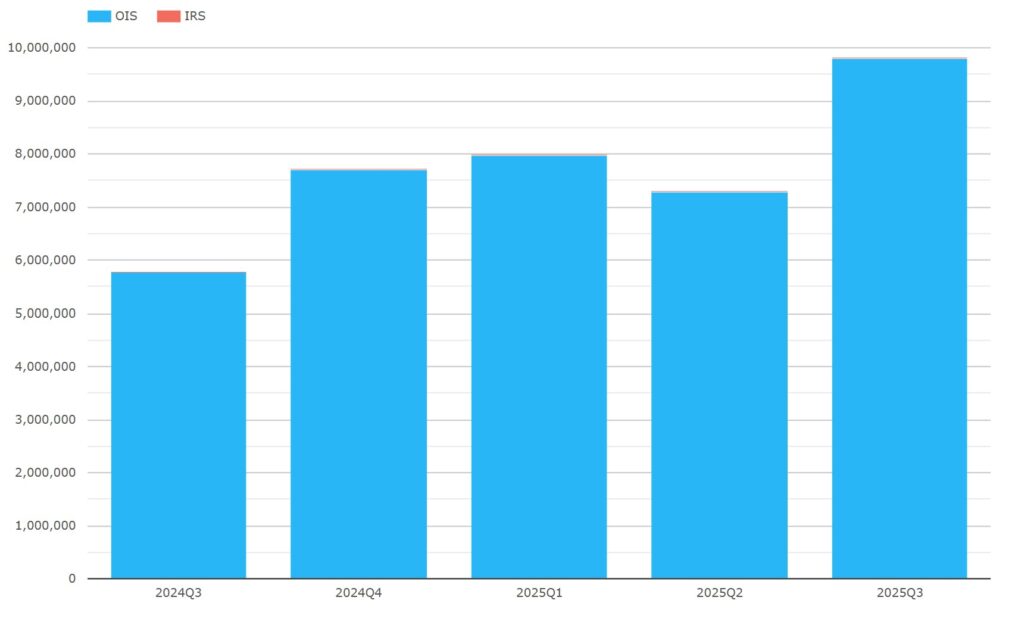
Chart 8: CAD IRS and OIS single-sided gross notional in CAD millions. Source: CCPView.
Chart 8 shows that, in Q3 2025, CAD IRS and OIS totaled C$9.81 trillion – up 35 percent QoQ, and up 70 percent YoY. This new record exceeds the prior record of C$7.99 trillion set in Q1 2025.
LCH SwapClear had 99.96 percent of the volume.
Though invisible due to the scale of the chart, CDOR IRS was C$4.46 million in Q3 2024, so we expect the next edition to cover only CORRA OIS.
At an FX rate of 1.395, the C$9.81 trillion total is equivalent to US$7.04 trillion.
EMEA IRS and OIS
Now let us switch to volumes of EMEA swaps (OIS and IRS) by currency (excluding EUR and GBP).
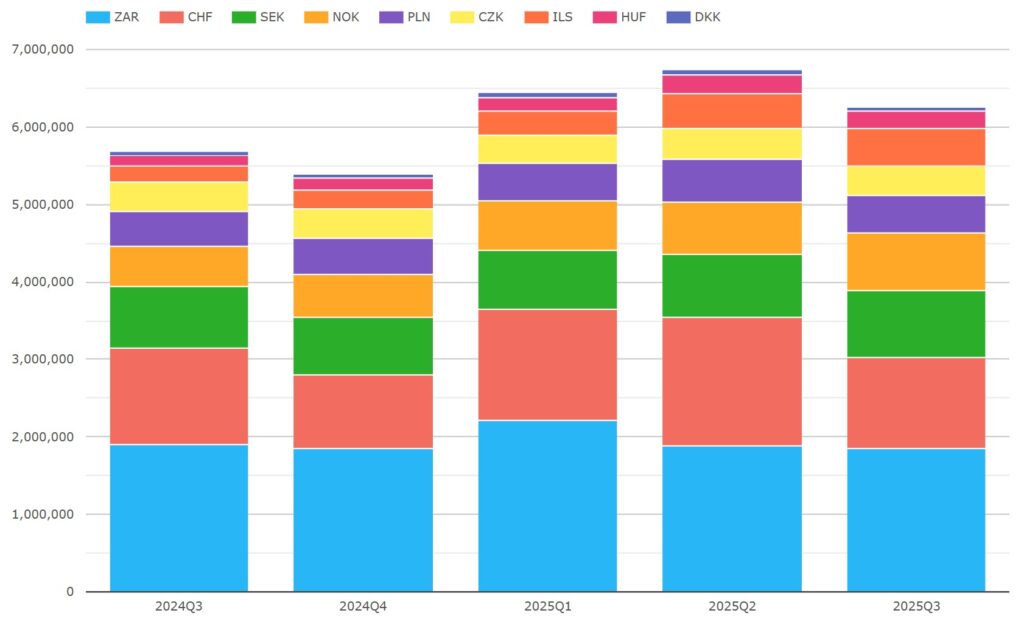
Chart 9: EMEA swaps single-sided gross notional in USD millions. Source: CCPView.
Chart 9 shows that, in Q3 2025, EMEA currency IRS and OIS totaled $6.25 trillion, down 7.2 percent QoQ, but up 9.9 percent YoY. Volumes were up in all currencies from a year earlier, except for ZAR and CHF.
- ZAR was the largest currency at $1.85 trillion – down 2.9 percent YoY.
- CHF was next largest at $1.18 trillion – down 5.9 percent YoY.
- SEK had $865 billion – up 9.9 percent YoY.
- NOK had $736 billion – up 41 percent YoY.
- PLN had $482 billion – up 8.6 percent YoY.
- ILS had $477 billion – up 126 percent YoY.
- CZK had $394 billion – up 2.1 percent YoY.
- HUF had $219 billion – up 66 percent YoY.
- DKK had $53.3 billion – up 1.3 percent YoY.
CCP market shares saw LCH take more than 99.5 percent in each currency except for the following where CME share was lower.
- CZK was split LCH 98.1 percent and CME 1.9 percent – down from 3.6 percent QoQ.
- PLN was split LCH 97.6x percent, KDPW 1.1 percent, and CME 1.2 percent – down from 3.3 percent QoQ.
- HUF was split LCH 96.9 percent and CME 3.1 percent – down from 4.8 percent QoQ.
AsiaPac IRS and OIS
Now let us switch to volumes of AsiaPac swaps (OIS, IRS) by currency (excluding JPY and AUD).
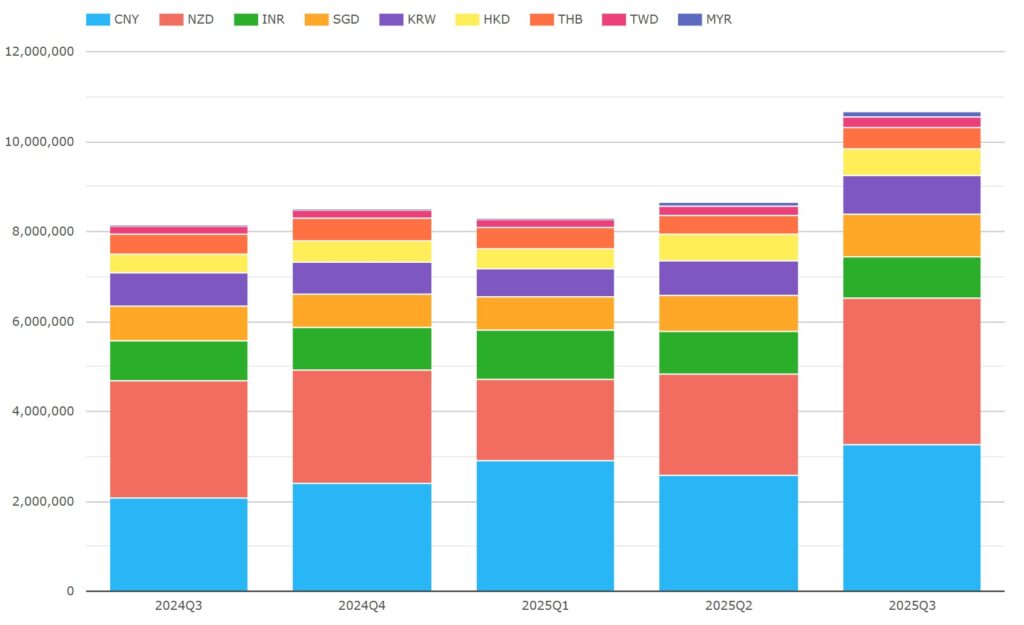
Chart 10: APAC swaps single-sided gross notional in USD millions. Source: CCPView.
Chart 10 shows that, in Q3 2025, APAC currency IRS and OIS totaled $10.7 trillion, a record quarter – up 23 percent QoQ and up 31 percent YoY. Volumes were up YoY in all currencies, with YoY increases over 25 percent in NZD, CNY, HKD.
- NZD was the largest at $3.27 trillion – up 25 percent YoY, and up 45 percent QoQ.
- CNY came next at $3.25 trillion – up 57 percent YoY, and up 26 percent QoQ.
- INR had $934 billion – up 5.7 percent YoY, but down 1.3 percent QoQ.
- SGD had $931 billion – up 17 percent YoY.
- KRW had $871 billion – up 22 percent YoY.
- HKD had $593 billion – up 39 percent YoY.
- THB had $478 billion – up 9.3 percent YoY.
- TWD had $217 billion – up 20 percent YoY.
- MYR had $128 billion – up 57 percent QoQ, after starting clearing in Q2 2025.
Calculating Q3 2025 market share by CCP, LCH had 100 percent in every currency except the following.
- CNY split LCH 26.8 percent and Shanghai 73.2 percent – up from 70.2 percent QoQ.
- INR split LCH 72.1 percent and CCIL 27.9 percent – down from 31.0 percent QoQ.
- HKD split LCH 99.7 percent and HKEX 0.3 percent – down from 0.5 percent QoQ.
LatAm IRS, OIS, and ZCS
Next, let us look at LatAm swaps by currency. Note: that the bulk of BRL and CLP are reported as zero coupon swaps (ZCS) by CME, while LCH reports only IRS. For more information on BRL swaps, see our prior blog.
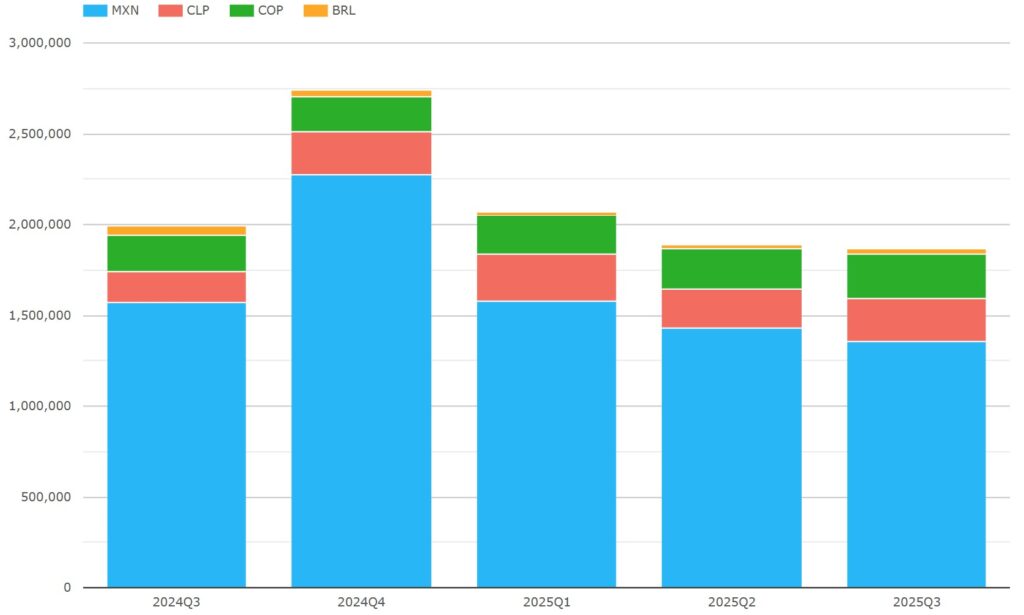
Chart 11: LatAm swaps single-sided gross notional in USD millions. Source: CCPView.
Chart 11 shows that, in Q3 2025, LatAm swaps totaled $3.01 trillion – down 3.7 percent QoQ, and down 17.7 percent YoY from $3.66 trillion in Q3 2024. YoY volumes by currency were down for the two bigger currencies but up for the two smaller currencies.
- MXN was the largest with $1.36 trillion – down 14 percent YoY.
- BRL came next with $732 billion – down 44 percent YoY.
- CLP had $680 billion – up 14 percent YoY.
- COP had $245 billion – up 23 percent YoY.
Calculating Q3 2025 market share by CCP, CME had more than 95 percent of all four currencies.
- CME’s share of MXN rose to 96.7 percent. This came at the expense of Asigna/Mexder share, which was 0.3 percent – down from 3.0 percent QoQ.
- LCH shares of MXN, BRL, and COP rose while remaining below 5 percent. This came at the expense of Asigna/Mexder share for MXN, and CME share for BRL and COP.
That’s it
The 11 charts included in this blog gave us a global overview of vanilla cleared OTC IRD by quarter, CCP, currency, and product type.
The volumes in CCPView cover many more cleared instruments, metrics, and analysis parameters.
- Cleared instruments also include interest rate futures and options, other asset class futures and options, and cash US Treasuries.
- Volume metrics also include new trade count / DV01 / average daily volume (ADV), open interest (OI), OI change, and notional unwound/matured.
- Analysis parameters also include date / week / month / year, exchange, product subtype, tenor, and activity type (D2C or D2D trade).
For more details, please contact us for a CCPView demonstration.