Following on from my blog, SEC Security-Based Swap Data Repositories Are Now Live, I wanted to take a look at Equity Total Return Swap volumes.
OTC Equity Derivatives (USD)
Let’s start by using SBSDRView to see the products and volumes reported for trades denominated in USD.
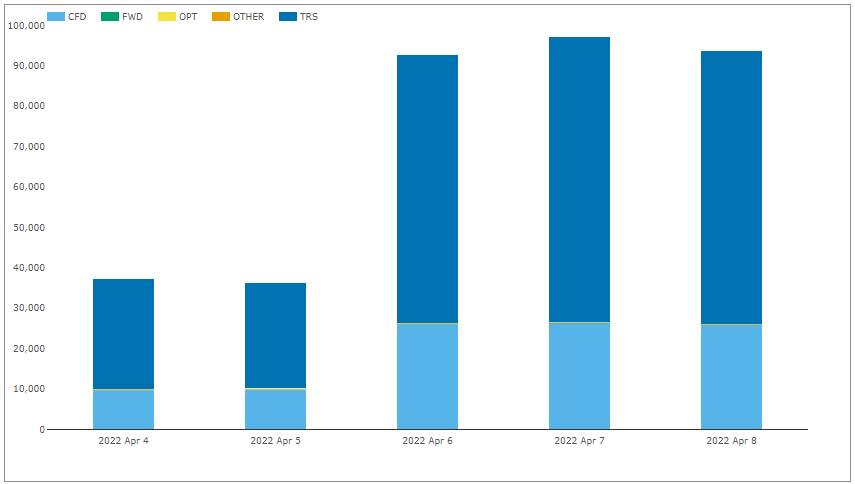
- TRS with @ 70,000 trades on each of Apr 6, 7, 8th
- CFD with @ 25,000 trades on these same days
- CFD volumes are surpising given that this is not a permitted product for US traders
- A tiny number of Other, Options and Fowards
Switching from trade counts to gross notionals.
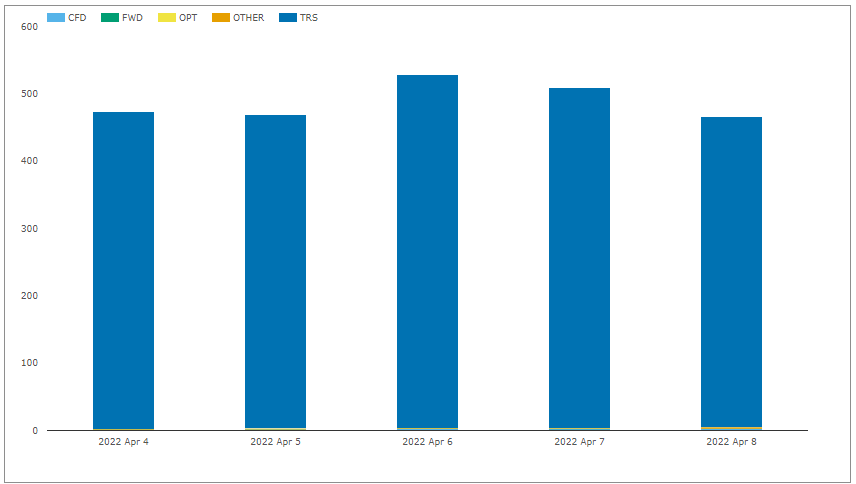
- TRS dominating volume with @ $500 billion each day!
- CFD far smaller, with just $2b to $3b each day
- Others even smaller
So, lets look a little closer into TRS.
Equity TRS (USD)
First by looking at the number of usd denominated TRS that are capped at the maximum disclosed size of $250 million, versues ones below this threshold.
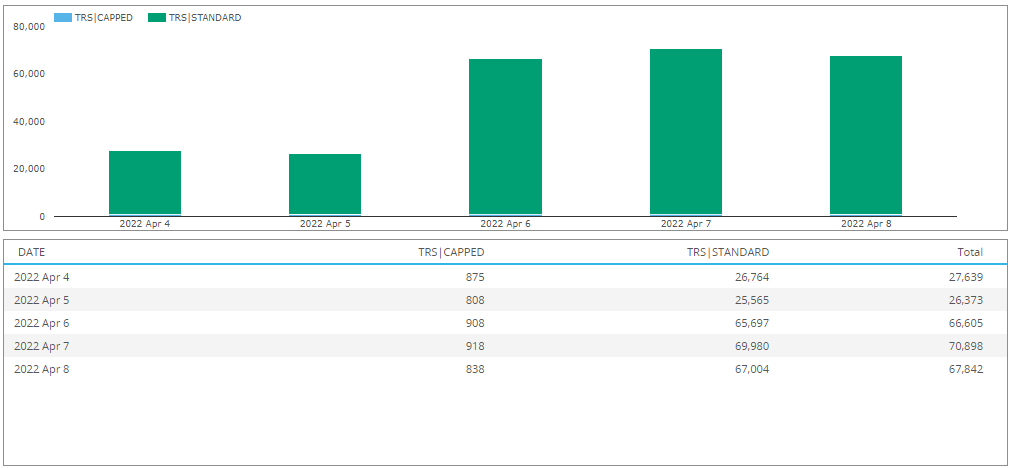
- 800-900 trades a day are capped, so at or above $250 million each
- 65,000 to 70,000 trades a day are standard, so below this threshold
Switching from trade counts to gross notionals.
- Total notionals of capped and standard trades similar
- $200 billion of capped on April 8 to $250 billion of standard trades
- Meaning the average trade size for standard trades is $4 million
- While 800 to 900 trades a day are above $250 million each
- Though a suspiciously high number of these are on Korean or Indonesian stocks, perhaps even most of them, which may mean that the notional amounts that are stated to be in USD are actually KRW or IDR and thinking about it some more, $250 million on a trade on a single stock is a very big trade, so these TRS notionals for capped trades are likely to be wrong and need correcting. One to investigate further…
Looking at other available data fields, we note the following:
- A small number of TRS are on (narrow) baskets/indexes, @ 200 a day
- All trades are uncleared and not on Swap Execution Facilities
- The list of equities is not just US stocks, but non-US stocks too
- A wide range of tenors are reported, though most trades are under 1Y
- With 1M the most frequent tenor
- Though far too many trades do not have an end date set, ….
- (A total return must be for a period, between a start and end date)
We also note that the SEC is proposing a regime to register and regulate SBSEFs and a public comment period of 60 days will start from publication of the proposal on the SEC’s website. One to watch with interest as it progresses in the rulemaking stage.
(I know a smaller point in the scehme of things, but if nothing else the quality of public dissemination data produced for On SEF trades under CFTC rules is of higher quality than for Off SEF trades).
Equity TRS by currency
Next, lets look at TRS trade counts by the currency of the trade.
We can do that using the Clarus Microservices API, in just one line of python.
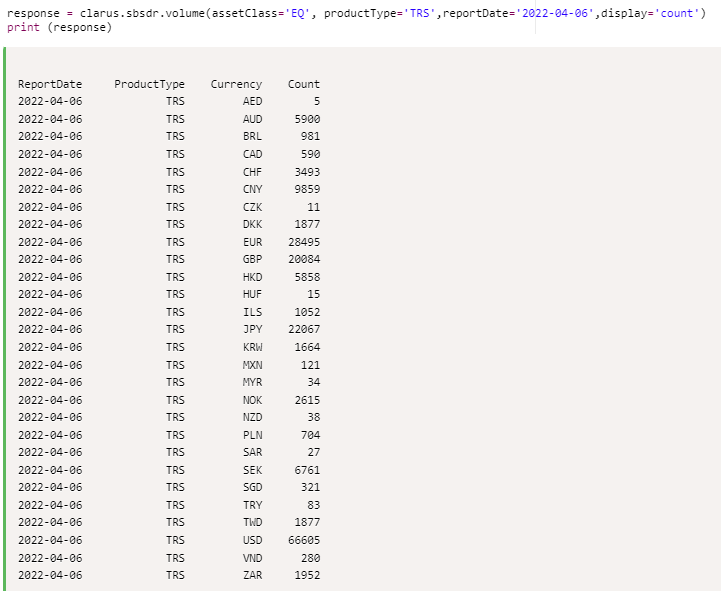
Showing trades in 28 currencies, most trades in majors, but many in minors or EM (on stocks listed on the markets of those currencies e.g. HUF or ILS).
Let’s look in detail at trades in the first currency in our list, AED, the UAE’s Emirati Dirham.
Again, just a single line of python, this time with a few more parameters.
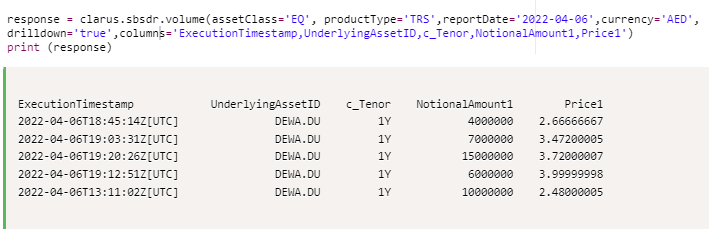
Showing 5 trades reported, on Dubai Electricity & Water Authority (DEWA), all 1Y and the price column looks like it is showing the initial stock price, while I cannot find the spread on the funding leg, which I would want to see. Still very interesting to see what traded.
That’s All
That’s all I have time for today.
There is a lot of data to look into.
Filter, analyse and understand.
It’s going to be a busy summer.