My last article on SDRFix was on Oct 28, 2013 and the prior one on Sep 25, 2013, so I thought it was time I provided an update.
What is New?
Today we released a new version with the following:
- USD IRS fixing to only use On SEF Cleared trades
- A new fixing for Cross Currency Basis Swaps in EUR/USD
- Drill-down to trades
- Methodology changes
ON SEF for USD IRS
As from Feb 18, 2014, USD IRS are Made Available to Trade (MAT), there is now good On SEF volume.
Sufficient voume for us to change the criteria of including trades in the index calculation (for 11am EST & 3pm EST) from Cleared Swaps to On SEF Cleared Swaps.
We have kept the existing fixing tenors of 2Y, 3Y, 4Y, 5Y, 7Y, 10Y, 30Y.
This means that the following MAT tenors are not currently available in SDRFix, 6Y, 12Y, 15Y, 20Y.
We intend to evaluate whether volumes are sufficient to add these.
As well as determining whether volumes are sufficient to make the same change for EUR IRS.
Cross Currency Basis Swaps
While this is a low daily trade volume market even for EUR/USD the largest currency pair, it is an important market.
To address this we have implemented a methodology that uses trades for a rolling 5-day window to calculate a VWAP for those tenors with sufficient volume. Screen shot below.
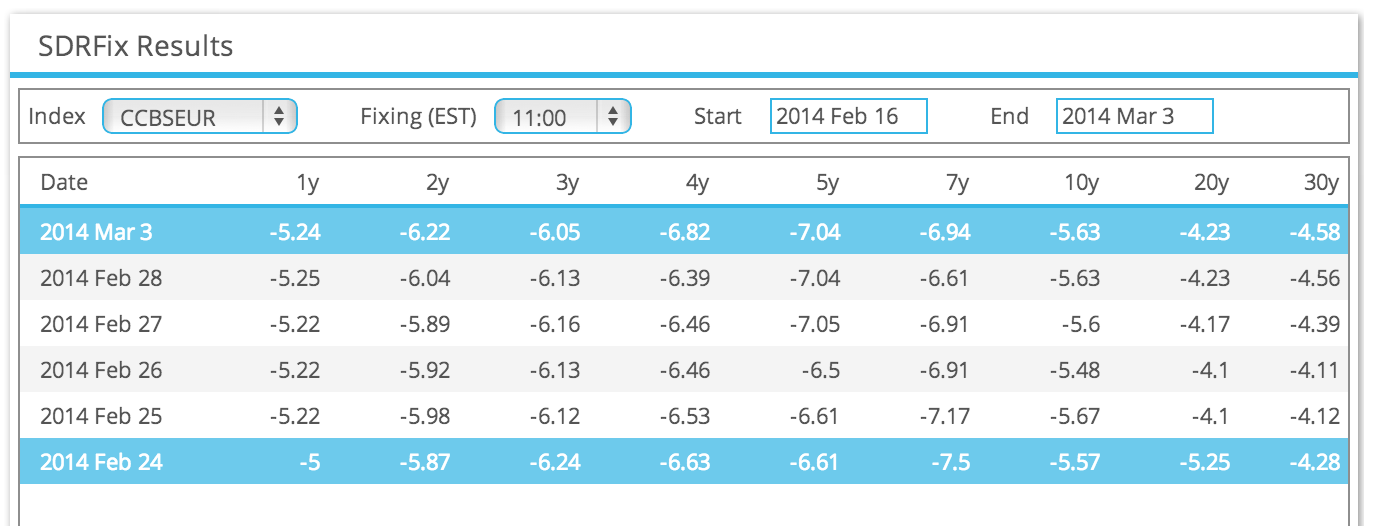
From which we can see:
- Fixing values for Mar 3, 2014 and the prior week
- The tenors we have determined to be of interest
- The values in basis points
- For 5Y, these range from -6.61 bps to -7.04 bps, so a drop of 0.43bps
Drill-down to trades
We also now provide a table of trades included and excluded for the fixing determination.
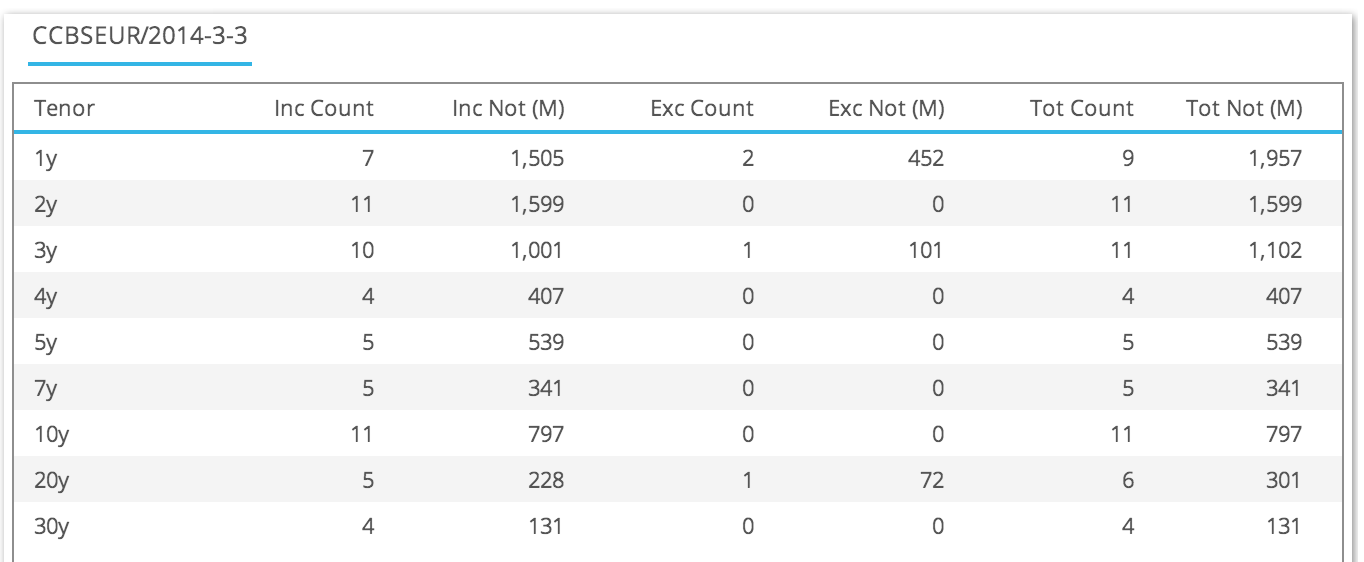
From which we can see:
- The number of included trades and gross notional
- The number of excluded trades and gross notional
- The total number of trades and gross notional
- For 3Y, 10 trades representing €1 billion have been included in the calculation
- For 3Y, 1 trade representing €101 million has been excluded (as an outlier)
And even better, you can click on any of these numbers to see the list of trades.
In a tabular or graphical form, with the graphical shown below.
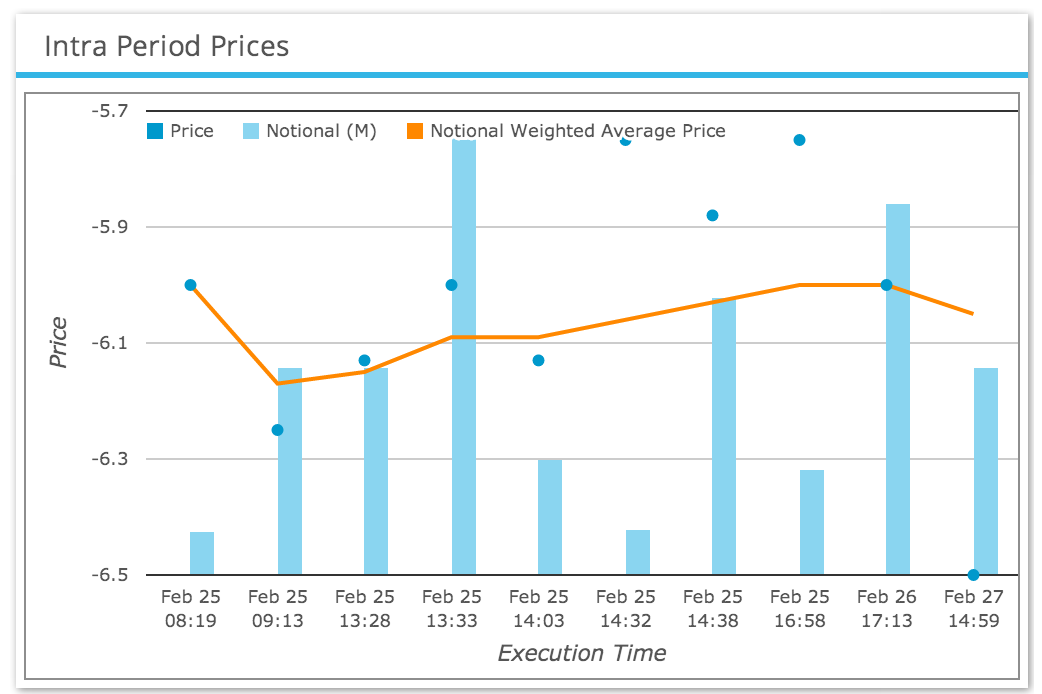
From which we can see:
- The time and volume of each trade
- The price of each trade
- The moving average of the VWAP
Complete transparency on the index determination.
What more could a user want?
Methodology Changes
As well as improvements in the handling of cancel and correct transactions, we have improved the index methodology.
We now use Median Absolute Deviation (MAD) as this has proven better at finding high and low outliers to discard.
For details of the methodology, see SDRFix methodology.
Summary
We continue to enhance SDRFix.
For new products and new market changes.
We continue to improve SDRFix.
For better transparency and better methodology.
We invite you to use SDRFIX.