Four calendar weeks are in the books. A common trend is emerging. Story is really the same as last week.
SAME OLD STORY
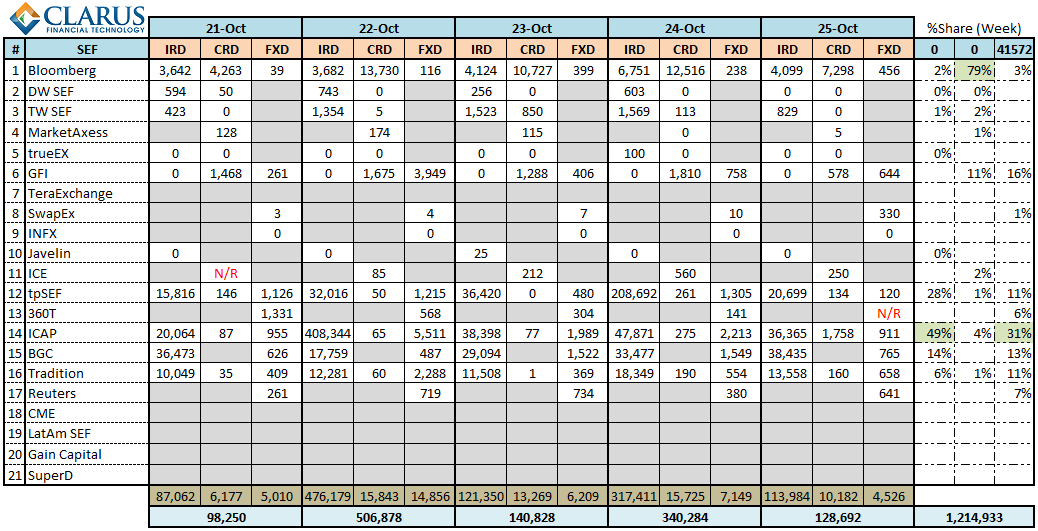
- CREDIT: Bloomberg continues to post the most impressive scores in this asset class, consistently accounting for 70-80% of the daily volumes and 79% for the week overall. GFI is the strongest IDB.
- FX: ICAP has the largest FX numbers. The other 4 IDB’s join Reuters & 360T for a close battle between 2nd through 7th place.
- IRD: ICAP and Tullet take turns in the lead, with BGC in another photo-finish for 3rd. The strength of ICAP’s and Tullet’s numbers appear to hinge on the weekly FRA reset volumes (RESET vs TP Match, respectively).
THE NUMBERS
THE USUAL TURMOIL
Collecting this weeks data once again proved challenging. If you read last weeks post you are aware I have proposed some best practices for SEF reporting. One of those is that SEF’s should make historical daily reports available. Case in point, this week I had failed to collect Monday’s data, so was forced to request the data from the 7 firms that do not post it. Later in the week, I dropped an email to one person at each of the SEF’s in question, or if I didn’t have contact details for someone, I left a request on the website contact page. Tradition, BGC, 360T, Tullet, MarketAxess and Tradeweb were all quick to respond. This gave me some faith in mankind. However, no SEF has made any changes to their reports in response to my proposed best practices guidelines!
NEVER THOUGHT I’D BUY IT
While simply collecting the raw source data can be a challenge, normalizing it is much much worse. I’ve complained about one firm in particular that reports in PDF format, does not denote the currency or asset class, and has been prone to listing a product called “null”. You will be glad to know I have found a solution, however it did cost me: Adobe Acrobat.
Yes, like most people, I have made it thus far in life without once paying Adobe for anything. But I found a potentially nice feature in Adobe which lets you export even the most challenging of PDF’s to Excel, and it had a free 30 day money-back guarantee if it did not solve my problem. Well, I am glad to report that it worked out, saving me probably 2 hours of copying, pasting, importing, parsing and re-arranging data, even before I begin to run queries on it. And I did not have to install some virus-ware to do it.
Anyone know who at BGC I can send the $25.87 bill to?
Just kidding. The tool provides great value (what is 2 hours worth to you?), so I look forward to many saved hours over the coming year.
FREE STUFF
My experience with Adobe made me question: “How does Adobe make money”? There are freeware tools that do similar things, granted they are not as good. And they don’t use advertisements.
Probably the same answer as how we at Clarus make money with our SDRView. Besides our pay subscriptions, we give away a slimmed-down free version, and free 30 day trials to the paid versions. While there are some tools that do similar things, they are not nearly as broad, informative, or intuitive to use.
While SDRView is not able to report volumes by individual SEF (this is not mandated to be SDR-reportable), it does give you overall SEF volumes (ON or OFF facility) by product type. And unlike the SEF reports, it can tell you the number of trades traded ON or OFF facility. In fact I used it a handful of times tonight when I wanted to validate some of the larger FX trades, to make sure the SEF was reporting the notional in the appropriate currency. It all reconciled.
So check out SDRView. It’s free for a month. It may save you many hours.
UPDATE
This weekly issue of SEF updates is not the most current. To see all SEF posts, including the most recent, please click through to the SEF Category.
*SPECIAL NOTE. The table has been updated on Wednesday 30-Oct after it was brought to my attention that the source data for ICAP needed to be changed. New files were received and the table updated. The original table can still be found here.
Tod
I know this is work each week already but is there any chance of:
– Splitting C2D and D2D out and having subtotals for each and doing share percentages of the subtotals?
– Putting on the same grid SDR totals per asset class for on SEF and off SEF across all product variants and calcing C2D and D2D totals above as percentage of the on SEF SDR volumes?
Best
Jon
Tod,
i wanted to commend you for your good work here. The Institute for Financial Markets is an industry sponsored non profit education foundation. We are a sister company to FIA. I have been using you posts in my classes on cleared swaps to show my students (industry professionals) your summary of volumes with your url clearly identified.
Thanks
kevin baldwin
[email protected]
director, education
Kevin,
Happy to hear you are making good use of it. If you are not doing so already, you should use SDRView to give further insight into the OTC market.
Thanks Jon. Indeed those are good ideas. In my week 2 update I did some SDR/SEF analysis on vanilla swaps but not to this extent. But I like your thinking, I’ll put them on my list,
Hi Tod,
Interesting stats. Quick question, what the units used? For example, for credit the figures look a bit high for traded sides, so I presume it’s gross notional (in USD MM)?
Thank you.
Units are indeed million USD equivalents.