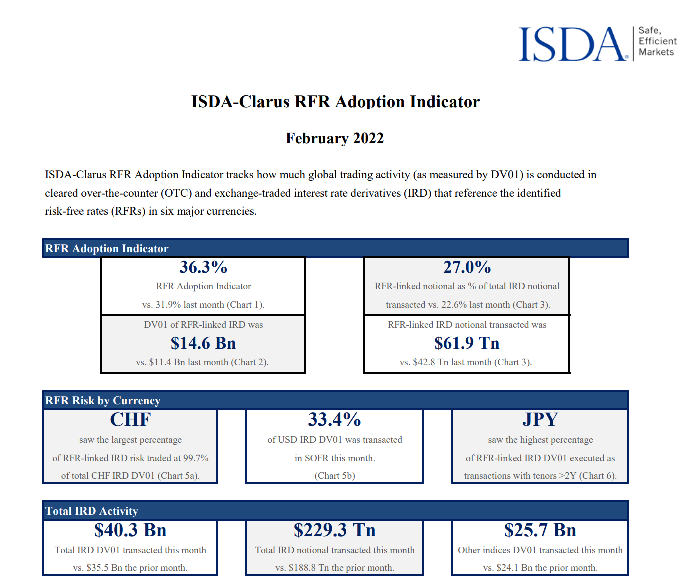
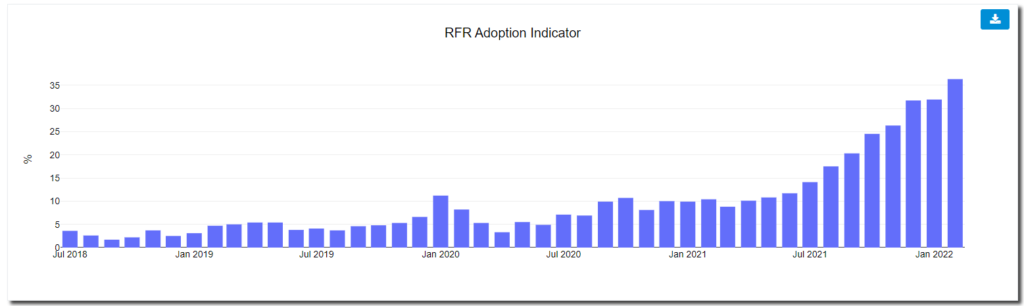
- The RFR Adoption Indicator hit new all time highs in February of 36.3%.
- Nearly 100% of the GBP, JPY and CHF markets are now traded vs RFRs.
- SOFR adoption has increased to 33.4% of overall USD Rates risk.
- The increase in RFR activity has happened in very active markets.
- February 2022 saw the most amount of Rates risk traded since March 2020 and the largest amount of RFR risk ever recorded.
The ISDA-Clarus RFR Adoption Indicator for February 2022 has now been published.
Showing;
- A new all-time high of 36.3% for the overall RFR Adoption Indicator.
- February 2022 was the twelfth consecutive monthly increase in RFR adoption, dating back to March 2021.
- SOFR adoption increased to 33.4%.
- SOFR trading has now more than doubled since October.
- Virtually 100% of trading is now in RFRs for CHF, JPY and GBP. There is little reason to expect this to change in the future.
- $14.6bn of RFR DV01 was traded, nearly 30% higher than last month!
RFR Adoption was very strong last month. The charts really highlight it:
It is a particularly strong sign for adoption that RFR trading increased in market share whilst trading was elevated in volatile markets. I have often commented that “old habits die hard” whilst monitoring the transition. Unusually for RFR adoption, that doesn’t seem to have been the case in February 2022 (or was it? – see section “What Products Make Up USD Activity” below).
Last month saw the largest amount of overall Rates risk traded since March 2020, with just over $40bn DV01 transacted:
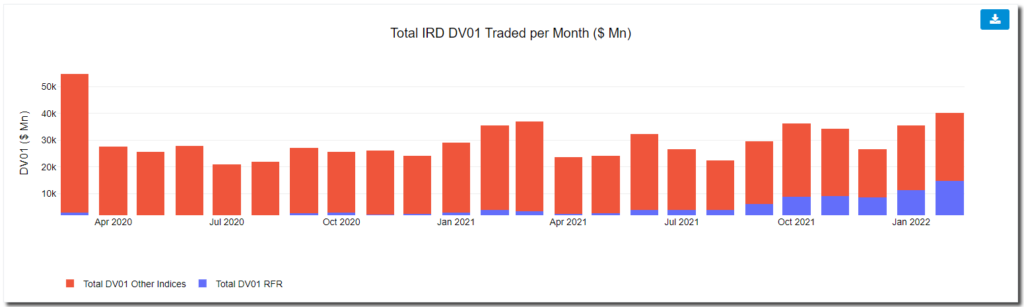
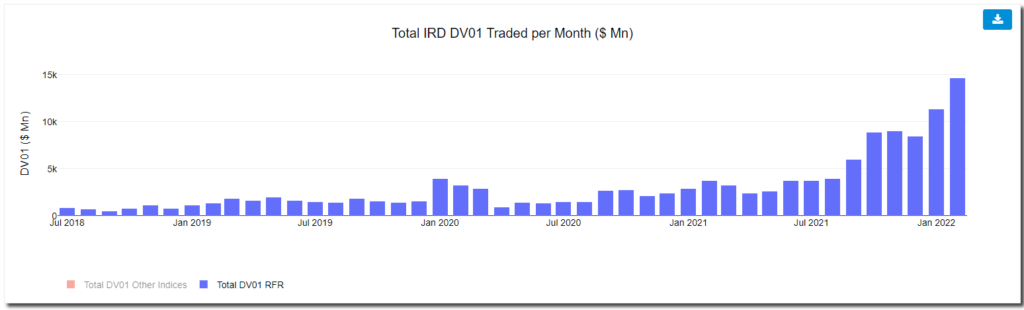
By extension, this means that we also saw the largest ever amount of RFR risk traded. Zooming in on that data reveals a steep rise in RFR activity:
Why Is the Overall Adoption Indicator not Higher?
Consider the overall state of RFR Adoption at the moment;
- 100% of trading in GBP is in SONIA
- 100% of trading in CHF is in SARON
- Nearly 90% of trading in JPY is in TONA
- Over one-third of USD markets are versus SOFR
For first time readers of this blog (where have you been?!), it might seem strange that the overall level of RFR Adoption isn’t higher. Why are we still below 50% adoption if half of our six currencies are trading almost all of their risk versus the RFR?
There are two reasons:
- The USD market is much larger than every other market. The total USD DV01 traded last month against both SOFR and “legacy rates” was $23.1bn, representing 57% of the total Rates risk across all 6 currencies. The next largest was EUR with “just” $12bn in DV01.
- Adoption in EUR and AUD remains at relatively low levels. RFR adoption is certainly higher than prior to the LIBOR cessation – maybe RFR First in XCCY is helping? However, both currencies have some way to go to encourage further adoption:
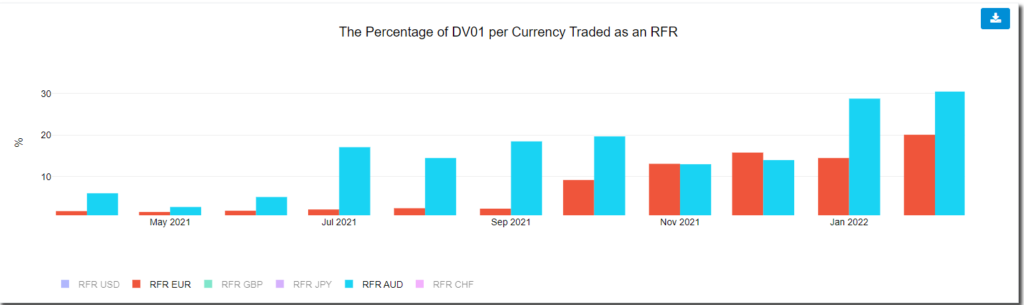
In AUD, the amount of RFR traded (AONIA) tends to fluctuate directly in association with whether the RBA is considered “in play” or not. With inflation a concern across all major economies, there is a lot of short-end repositioning going on.
It will be interesting to see what effect central bank positioning will have on €STR activity. With a more hawkish ECB recently, will this also lead to more activity in €STR at the short end of the curve? The total DV01 of €STR risk traded last month was $2.4bn, about $1bn more in DV01 than was traded last month. That is an impressive spike in activity!
What Products Make Up USD Activity outside of SOFR?
Elsewhere, let’s do a quick analysis of USD activity. Working out which products make up USD activity is a surprisingly complex question to answer. I will try to highlight the key points with just two charts.
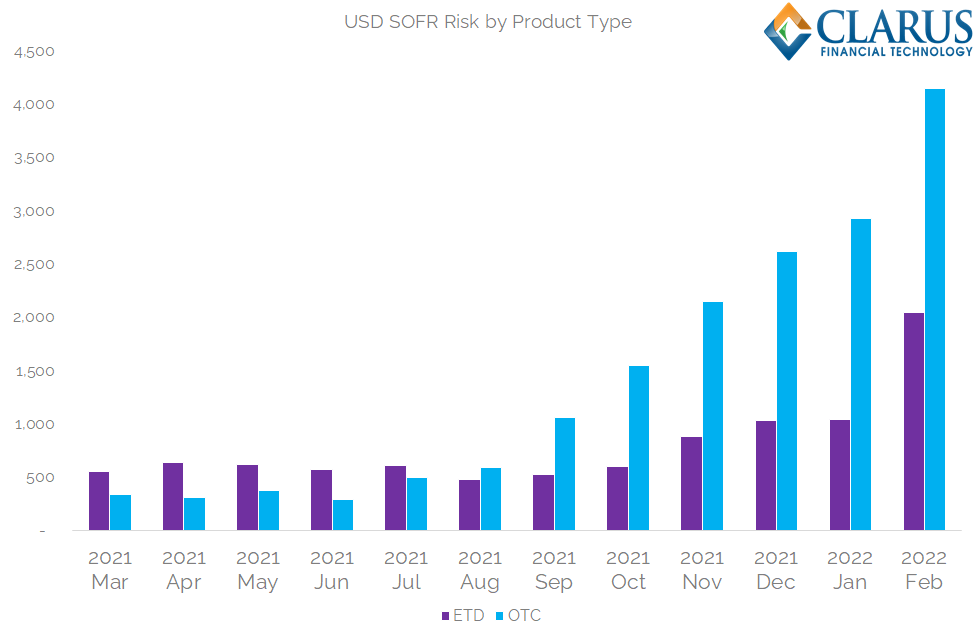
- Here is the SOFR risk traded in OTC Swaps and ETD Futures contracts. Each product is seeing increases in SOFR risk, but SOFR First in OTC markets has helped make this by far the larger of the two SOFR markets:
2. Secondly, here is the LIBOR risk traded in OTC Swaps and ETD Futures. LIBOR risk in ETD space is increasing again, probably in response to elevated market volatility:
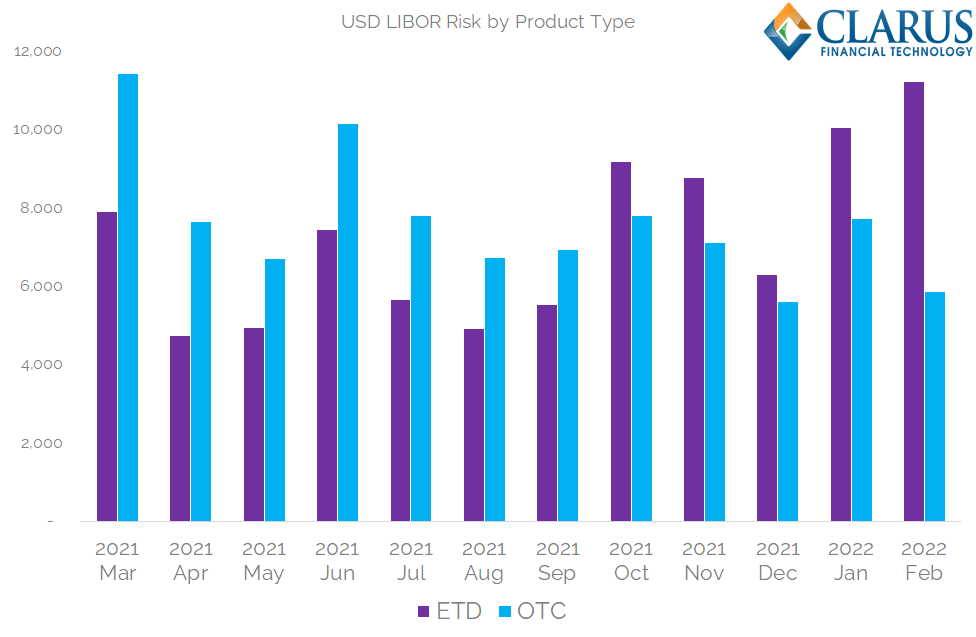
This increase in LIBOR activity in USD ETD markets helps explain why the overall ISDA-Clarus RFR Indicator is not higher. Which leaves us with two final points to make today:
- Much of this ETD LIBOR activity will be short-dated, maybe even maturing before June 2023 USD LIBOR cessation.
- It might be that market participants are very comfortable with the ETD USD LIBOR Fallbacks, and even consider ETD LIBOR risk expiring after June 2023 as fully fungible with SOFR risk. Time will tell.
Either way it lends credence to the saying “Old habits die hard”.