As the spotlight turns to RFR Swaps, in a “will they won’t they take off and replace Libor”, we have added new RFR views in most of our data products, to help answer that question. Today I will use SDRView Researcher and our new IBOR-RFR view to shine a spotlight on RFR Swaps.
RFR Swaps in USD
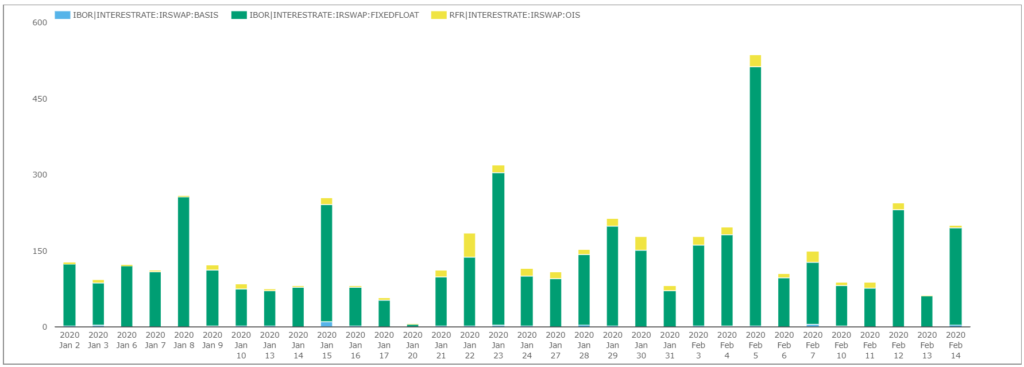
First let’s look at daily trade counts this year by Swap product, reported by US persons to US SDRs, for any product that references the SOFR index.
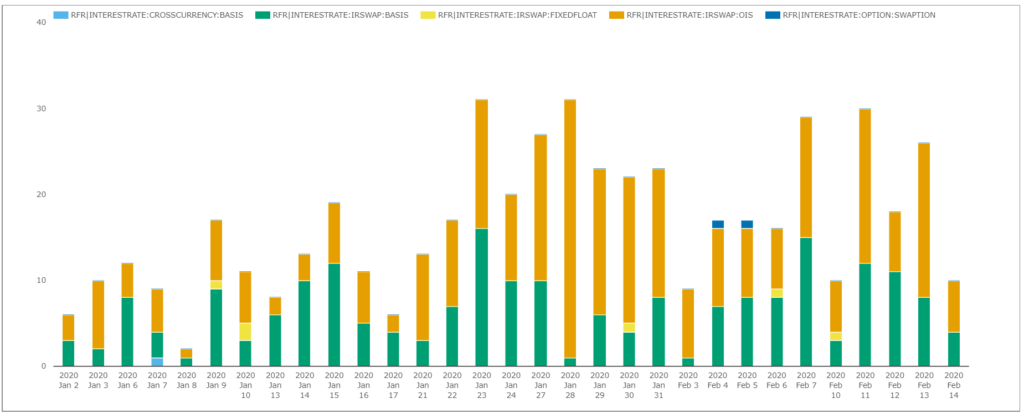
- 513 Swap trades in total, a YTD average of 16 per day and a 20-day average of 20 trades per day
- OIS Swaps, so SOFR vs Fixed, the most common with 296 trades or 12 per day (20d average)
- Basis Swaps, with 208 trades of which 177 are SOFR v FF and 31 are SOFR v LIBOR, an average of 7 per day
- 6 trades reported as IRSwap:FixedFloat, which should have been reported as OIS
- 2 Swaptions with 2 trades and 1 Cross Currency Basis Swap.
Let’s take a look at these last two products.
SOFR Swaptions
- The first trade on 4th Feb, is a 1Y10Y payer at 1.618%, the reported notional is capped at $170 million and the premium is 1.47% of notional, executed off SEF.
- The second trade on 5th Feb, is a 2Y10Y payer at 1.972%, the reported notional capped at $170 million and the premium is 1.58% of notional, executed off SEF.
We have no way of knowing how much larger these trades were than $170 million and it is interesting they are the only trades reported so far; a product to keep a close eye on this year.
Cross Currency Basis Swap
- A single trade on 7th Jan, GBP SONIA v USD Fedfunds, 10Y tenor out of 19-Jan, reported notional capped at $170 million or £129 million, at a basis spread of 1.25%
So far we don’t see any Cross Currency Basis Swaps with SOFR as the reference index on the dollar leg, which is surprising as this article in Risk highlights a USD SOFR vs CAD CORRA Swap between JPM and National Bank of Canada, executed on 10th January and given the US and CA parties involved, I would have expected it to be either in the US or CA DTCC SDR or both, while infarct it shows up in neither. Probably a reporting glitch.
Swaps Gross Notional
In SDRView, we can select Trades, Gross Notional or DV01, so let’s switch to gross notional.
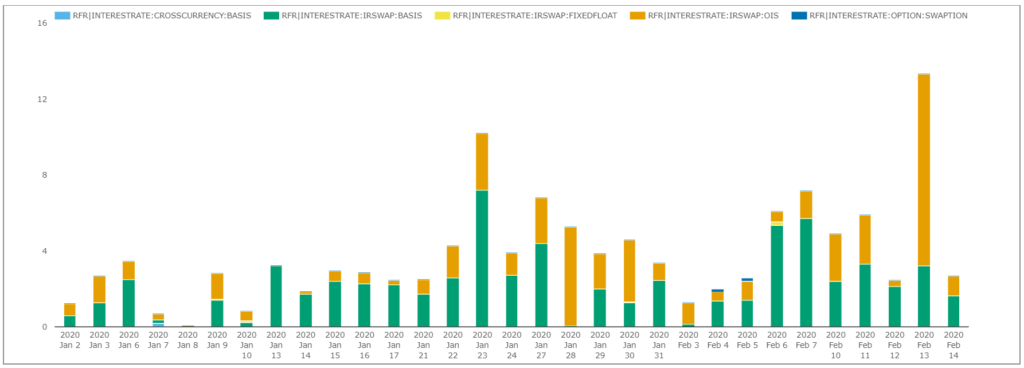
- $120 billion notional across all the products, Basis with $70 billion and OIS with $50 billion
- A daily average of $4.8 billion, the true figure probably 40% higher if we allow for capped notional rules.
Reasonable volumes, but far lower than Libor or FedFunds Swaps, so much so that not worth comparing in the same chart.
RFR vs Libor in GBP Swaps
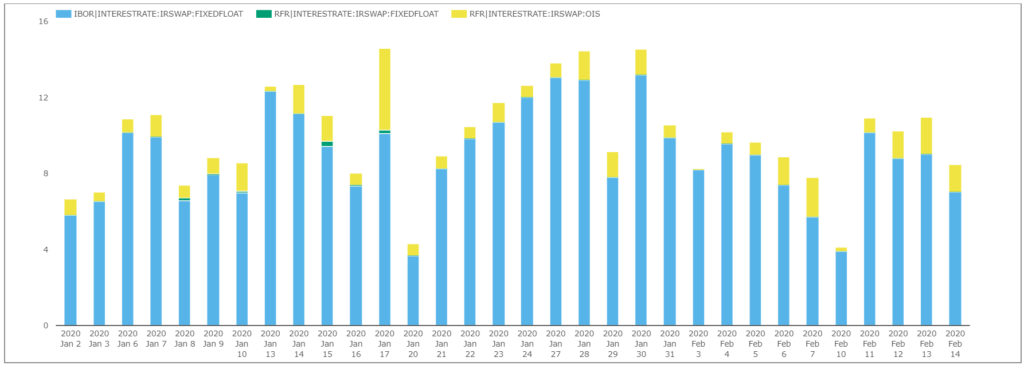
For a better comparison, let’s switch to GBP, where Sonia not being a new RFR, but a reformed exising index, has good volume to compare with Libor.
The IBOR-RFR view allows us to see both side by side.
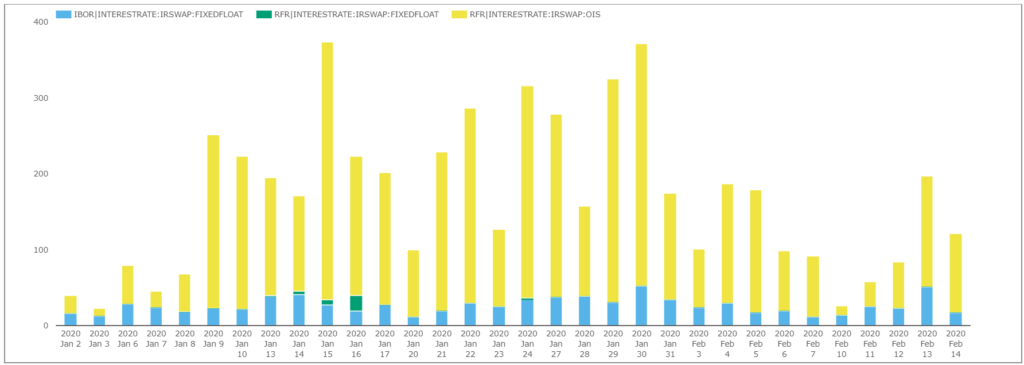
Showing that the GBP RFR, which is SONIA, dominating Libor in gross notional terms.
However that is a misleading chart and one that would change completely, if we switched to an equivalent risk measure such as DV01.
First let’s look at it another way, we have a new filter to isolate only those trades that mature after Jan 1, 2022, the expected cessation date for Libor. Selecting this for the same chart.
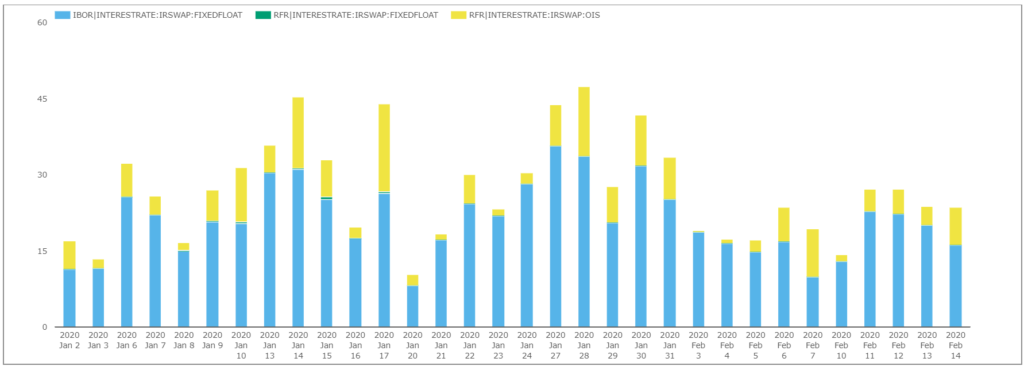
Shows that Libor gross notional dominates Sonia notional for trades maturing after Jan 1, 2022.
Next if we switch from notional to DV01, we see an even greater dominance of Libor.
- A daily average of £8.9m DV01 for Libor vs £1.1m DV01 for SONIA
- And if we compute a 10 day moving average, no significant increase in Sonia as a percentage of the total, the percentage hovering in the 10% to 12% of the total DV01 range.
- (While all this data is US person trading only, so a small portion of the overall GBP market, we know that it is representative of the overall market).
It will be very interesting to see how Sonia volumes develop in the next few weeks, see Will GBP Libor Stop Trading on 2nd March 2020.
It is a very tall order to see a massive shift in volumes two weeks.
More time will be needed and possibly the we also need to wait for term rates in Sonia to become available, which a few firms are competing to publish.
CAD – CDOR and CORRA
Before we end, let’s look at Canada, which operates a multi-rate approach, with both CDOR and CORRA co-existing as benchmarks, however over time it is expected that CORRA will become the predominant benchmark.
Showing the dominance of CDOR Swaps by trade count over CORRA.
That’s It
That’s all I have time for today.
SDRView has a new IBOR-RFR view.
To shine a spotlight on RFR Swaps trading.
Products, volumes and trade details.
Comparing trends of IBOR and RFR Swaps.
Please sign-up for a trial if this is of interest.
Or contact us for a demo.