- CNY Interest Rate Swaps are the 7th most traded IRS currency in 2023.
- This blog tells you all you need to know about swap market conventions in both onshore and offshore CNY swaps.
- Cleared CNY swaps are the most transparent markets. They are traded as either onshore deliverable CNY swaps or non-deliverable CNY swaps that have their cashflows settled in USD.
- There are also uncleared markets in both onshore CNY and offshore CNH swaps.
- We estimate that 41% of total trading occurs in cleared, onshore CNY swaps at Shanghai Clearing House.
CNY Interest Rate Swap Introduction
Before we look at some data on the Chinese swap markets, it is really important that readers are familiar with some of the terminology. Let’s start with the basics in terms of what the currency is actually called!
- CNY is the deliverable currency traded onshore in China. All cashflows for an onshore CNY swap are physically settled in CNY.
- CNH is the term used for CNY swaps traded offshore, outside of China. For a CNH swap, all cashflows still occur in CNY but are settled outside (“offshore”) China. They are called CNH to make the difference explicit.
- ND CNY swaps are non-deliverable swaps, typically traded offshore, outside of China. All cashflows settle in USD, referencing a market standard FX fixing – ISDA and SEFs reference the CNY SAEC fixing (“CNY01“) as the market standard.
- RMB is the “catch-all” name for the renminbi currency, wherever it is traded. Specifically, the renminbi is the official currency of the People’s Republic of China, with the yuan (CNY) being the basic unit of the renminbi.
- Think of it like “Sterling” (renminbi) is the UK (Chinese) currency, which is made up of “Pounds” (Yuan) and denoted by the standard “GBP” (CNY).
Interest Rate Swap Market Conventions
This blog looks at Interest Rate Swaps (IRS) – the most widely traded type of Rates derivative in CNY. Yes, Cross Currency Swaps and Interest Rate Options trade as well, but we focus on IRS for today’s blog.
Looking at SDRView data, revelas the following “market standards”:
| Non-deliverable CNY | CNY vs 7D Repo | CNY vs SHIBOR | |
| Fixed Leg | Payments: Quarterly Day-Count: Act 365 Fixed | Payments: Quarterly Day-Count: Act 365 Fixed | Payments: Quarterly Day-Count: Act 365 Fixed |
| Float Leg | Floating Index: CNY 7 day Repo Rate Payments: Quarterly Compounding: 7D | Floating Index: CNY 7 day Repo Rate Payments: Quarterly Compounding: 7D | Floating Index: 3m SHIBOR Payments: Quarterly Compounding: N/A |
| Settlement Currency | USD | CNY (onshore) CNH (offshore) | CNY (onshore) CNH (offshore) |
| Onshore Clearing | Bilateral only | SHCH | SHCH |
| Offshore Clearing | LCH SwapClear CME HKEX Bilateral | Bilateral only | HKEX (+vs CNH HIBOR) Bilateral |
For the onshore CNY market, CFETS publishes IRS data for the whole curve for swaps referencing both the Repo Rate and vs 3m SHIBOR. Take a look – it is a nice example of how transparent swap markets can be:

CNY trading therefore essentially operates across up to 6 pools of liquidity:
- CNY Cleared (at SHCH)
- CNY Bilateral
- CNH Cleared (at HKEX only I think)
- CNH Bilateral
- ND CNY Cleared (at LCH, CME, HKEX)
- ND CNY Bilateral
Interest Rate Swap Clearing
Can we estimate the relative sizes of these six pools of liquidity?
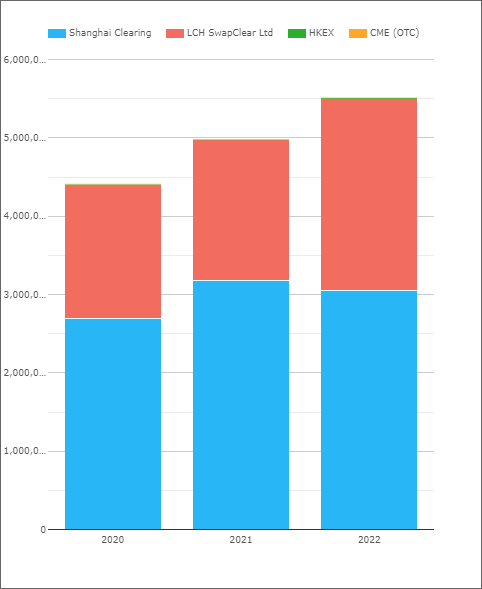
Cleared markets remain the most transparent. There are two CCPs who see significant volumes in CNY – SHCH and LCH SwapClear. The chart below from CCPView shows Average Daily Volumes for the past 3 years and in 2023 so far:
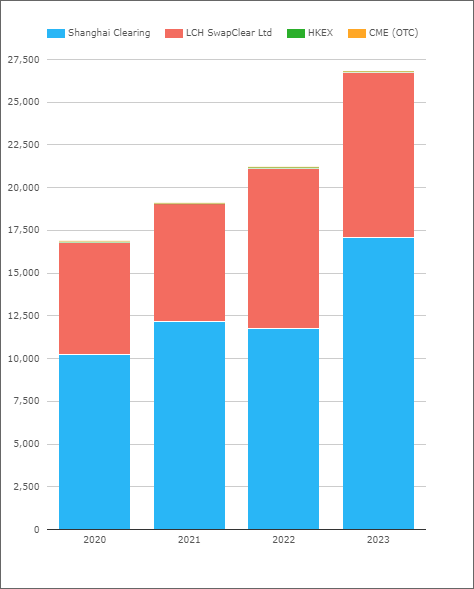
Showing;
- 2023 has been a stellar year so far in CNY swaps!
- Average Daily Volumes sit at nearly $27.5bn USD equivalent.
- This is significantly higher than 2022, which was already a record year.
- ADVs are 26.5% higher this year than last.
The data shows that “Cleared CNH” does not really trade (so far). Turning to the bilateral markets, we do not have the same degree of transparency. How much of the market might be uncleared?
The only source of data for global uncleared markets that we have is the BIS Trienniel Survey. The most recent data covers trading in April 2022, and suggests a total CNY IRS market size of $30bn in terms of Average Daily Volumes:
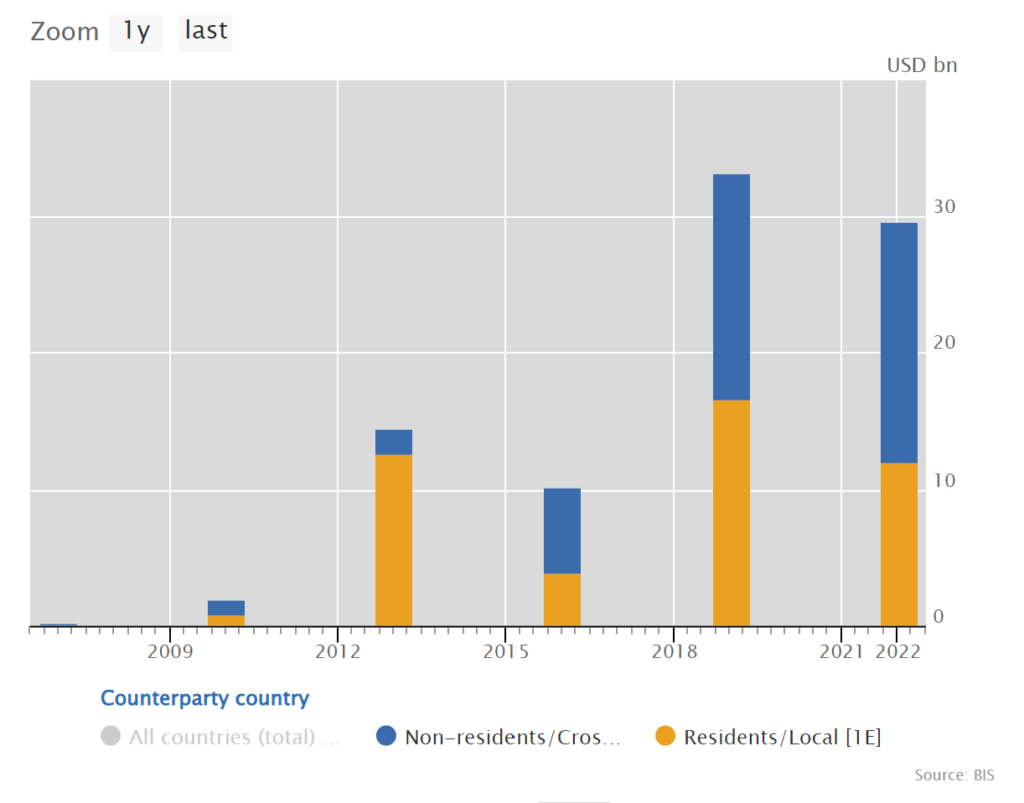
As the chart shows, the “offshore” or “non-residents” market has been growing significantly in each survey year. In 2022, “non-residents” made up 58% of volumes. Remember, this is across both cleared and uncleared volumes.
Given that we saw an ADV of $21bn in cleared CNY swaps last year, it suggests that 74% of total volumes are cleared. Is that really possible? It seems a very high clearing rate for a market with 6 different options. Taking the data at face value leads to the following tables:
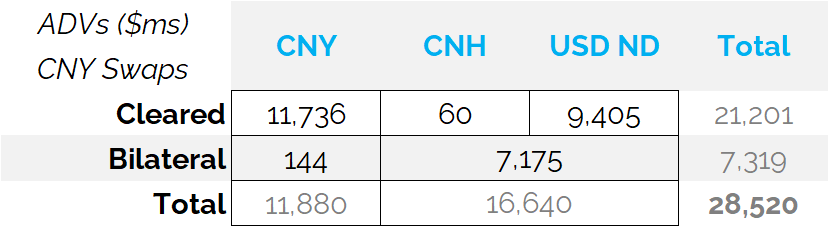
And expressed as percentages:
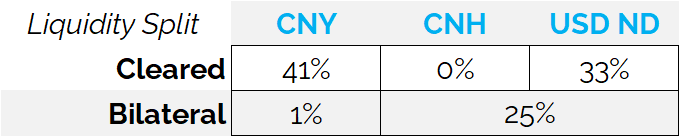
Assuming our interpretation of the data is accurate, that is a pretty good take-away for this blog!
Swaps Market Data
The two most transparent pools of liquidity are:
- Onshore cleared CNY interest rate swaps. These are cleared at the Shanghai Clearing House (“SHCH”) with the cashflows physically settled onshore in CNY.
- Offshore non-deliverable CNY interest rate swaps cleared at LCH SwapClear. These are settled in USD, which can have significant netting benefits for international swap market participants who have other cashflows in USD. LCH have a nice graphic on their non-deliverable swaps marketing material:
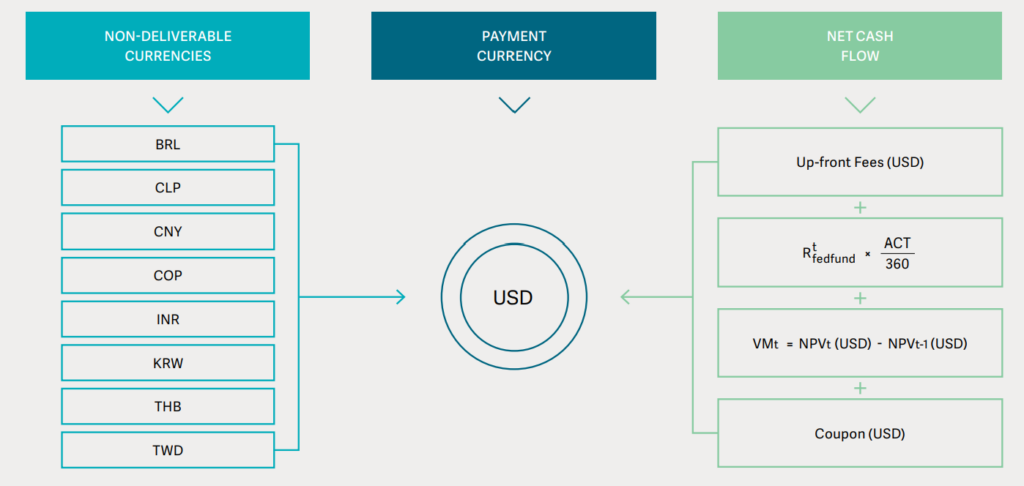
Whilst paying for everything in USD may look attractive from a portfolio perspective, it is not 100% effective as a hedge vs underlying CNY assets/liabilities because the FX rate of your payments will vary with time.
CCPView includes volumes for all of the CCPs that are active in CNY interest rate swaps:
I was pleased to read that both HKEX and Risk.net have recently quoted Amir’s CCP statistics for the relative market share of SHCH and LCH SwapClear. Returning the favour, here are some updated stats:
- The total notional volume of all CNY interest rate swaps traded in 2022 was $5.512Trn (in USD equivalents).
- This was an increase of 10.7% on 2021 volumes (+$533bn).
- This was on the back of a 13% increase in volumes from 2020 to 2021.
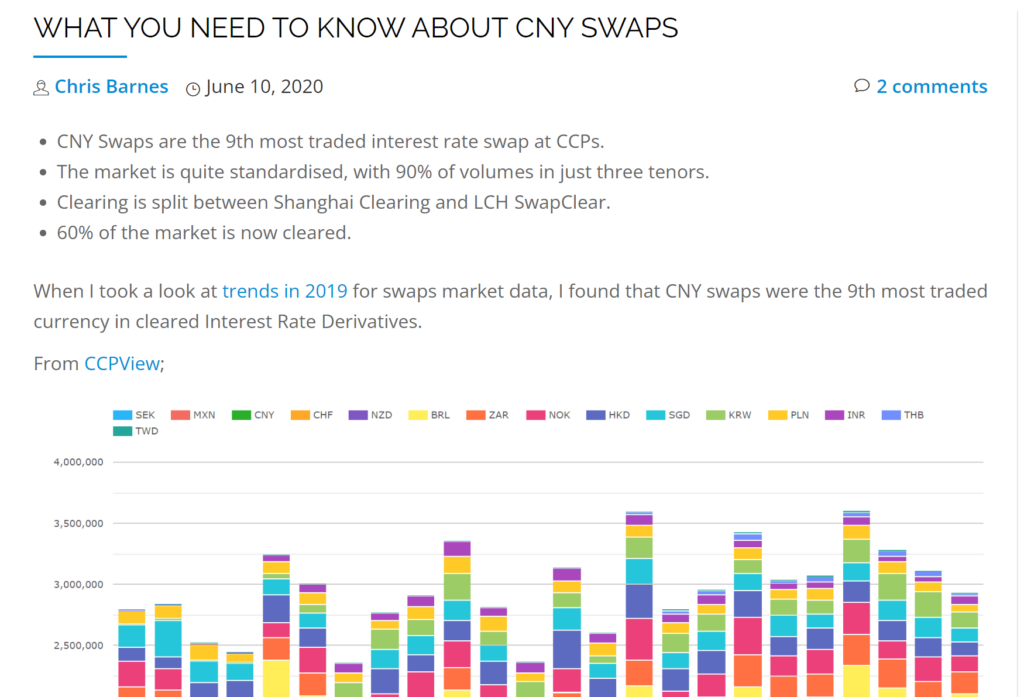
I took a look at some of the available data 3 years ago, which is well worth a refresher:
2023 Volumes
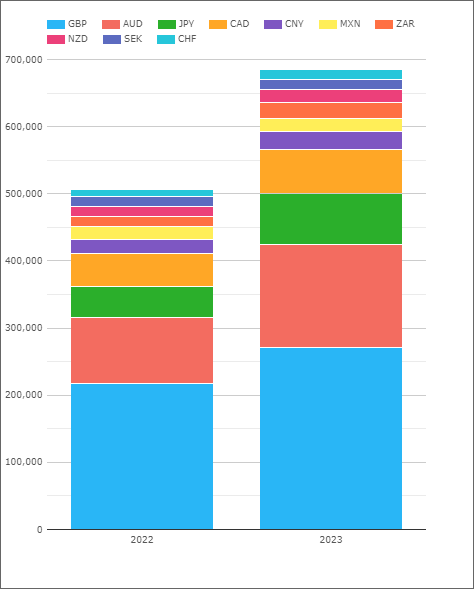
For 2023, let’s look at where volumes in CNY trading sit relative to other currencies in Rates derivatives:
Showing;
- Average Daily Volumes in $ notional equivalents for cleared OTC Rates derivatives, excluding USD and EUR.
- (USD and EUR are excluded due to scale – they are both much larger than any other swap markets)
- That makes CNY the 7th largest swap market in the world, with ADVs at $26.7bn in 2023.
- For context, it is larger than MXN, ZAR, NZD, SEK and CHF, but smaller than both CAD and JPY.
CCP Market Share
Finally, we can recast those ADVs in terms of market share statistics for the CCPs:
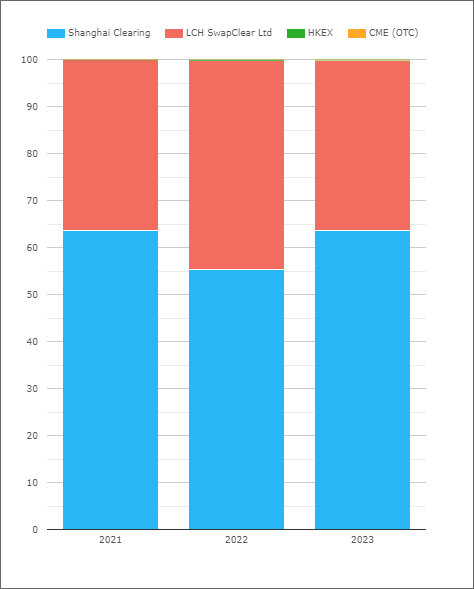
Showing;
- Shanghai Clearing with almost identical market share in 2021 and 2023 at 64%.
- HKEX and CME see very little volumes in CNY, with market shares below 1%.
- LCH SwapClear saw a significant change in its market share during 2022, clearing 44% of volumes.
- However, this has not persisted into 2023.
I am not sure how accurate it is to think of this as “market share” between the CCPs. The clearing houses are trading different products, as discussed above. Are they really competing for the same volumes?
Swap Connect
Finally, HKEX have recently launched a “Swap Connect” scheme, to bridge the gap between CNH and CNY IRS trading. You can read about it here. Depending on the volumes being traded, it will likely end up with a blog of its own in due course.
In Summary
- CNY IRS volumes are now the 7th most-traded swap market.
- CNY IRS liquidity is split across 5 or 6 different products. Market participants will need to understand all of them before making trading decisions.
- We provide the data you need to start trading CNY IRS.
Thanks! I was looking for you to gauge the impact of the recent announcement from HKEX allowing international investors to access on-shore interbank markets in China for interest rate swaps.
https://www.hkex.com.hk/News/News-Release/2023/230505news?sc_lang=en
https://www.hkex.com.hk/Products/OTC-Derivatives/Northbound-Interest-Rate-Swaps?sc_lang=en